Gross Rent Multiplier for BRRRR Investors: Fast Deal Screening
Discover how the gross rent multiplier helps BRRRR investors quickly screen deals, save time, and optimize property investments.
By DealAnalyzerAI Editorial Team
Real estate investing education and deal-analysis research from DealAnalyzerAI.

Gross Rent Multiplier for BRRRR Investors: Fast Deal Screening
The gross rent multiplier (GRM) equals property price divided by annual gross rent. For BRRRR investors, it works best as a fast first filter: run GRM before you spend time on rehab estimates, NOI projections, or refinance modeling. If a deal fails the GRM screen, skip it. If it passes, dig deeper. JPMorgan describes GRM as a quick estimator for multifamily investors, and that framing fits BRRRR workflows precisely.
Key Takeaways
GRM is a fast screening ratio, not a valuation model; always follow a passing GRM screen with NOI and cash flow analysis before committing to a BRRRR deal.
| Point | Details |
|---|---|
| GRM formula | Property price divided by annual gross rent; annualize monthly rents by multiplying by 12 first. |
| Good GRM range | Typical residential ranges vary depending on market, asset class, and local cap-rate environment. |
| BRRRR application | Compute GRM twice: pre-rehab for initial screening, post-rehab using stabilized rents for refinance planning. |
| Income basis risk | Always verify whether the GRM uses gross potential rent or effective gross income before comparing properties. |
| Dealanalyzerai | Automates GRM, ARV, and MAO calculations in one BRRRR-ready workflow, reducing screening time and risk. |
Table of Contents
- What the gross rent multiplier actually measures
- How to calculate GRM step by step
- What counts as a good GRM in your market
- How GRM compares to cap rate and GIM
- Limitations and common pitfalls of GRM
- How to apply GRM when evaluating BRRRR deals
- GRM is a starting line, not a finish line
- Dealanalyzerai cuts your GRM screening time significantly
- Sources
- FAQ
What the gross rent multiplier actually measures
GRM is a ratio, not a yield. It tells you how many years of gross rent it would take to cover the purchase price. A GRM of 8 means eight years of gross rent equals the price paid. That single number lets you rank dozens of listings in minutes without pulling tax returns or utility bills.
The word gross is doing real work here. Gross rent means the total scheduled rent before any deductions. Specifically, it refers to gross potential rent (GPR): what the property would collect if every unit were occupied and every tenant paid on time. That is different from effective gross income (EGI), which subtracts vacancy and credit loss. The formula uses GPR by default, and that distinction matters when you compare GRMs across listings.
Key inputs and exclusions:
- Included: total scheduled rent from all units, annualized
- Excluded: operating expenses (taxes, insurance, maintenance, management)
- Excluded: vacancy and credit loss adjustments
- Excluded: financing costs and debt service
- Excluded: any ancillary income (laundry, parking, storage)
Because expenses are excluded, two properties with identical GRMs can have very different actual returns. A building with deferred maintenance and high turnover will underperform a well-managed comparable even when both show a GRM of 9.
How to calculate GRM step by step
The formula is straightforward:
GRM = Property Price ÷ Annual Gross Rent
Most listings quote monthly rents, so annualize them first by multiplying monthly rent by 12 before dividing into the price.
Worked example:
You find a duplex listed at $240,000. Each unit rents for $1,000 per month.
- Monthly gross rent: $1,000 × 2 units = $2,000
- Annual gross rent: $2,000 × 12 = $24,000
- GRM: $240,000 ÷ $24,000 = 10.0
Wall Street Prep illustrates this concept with a similar example: $300,000 ÷ $60,000 annual rent = 5.0x, meaning roughly five years of gross rent to cover the purchase price. Your duplex at 10.0 would take twice as long, which may or may not be acceptable depending on the market.
Step-by-step screening process:
- Pull the listing price from the MLS or wholesaler sheet.
- Confirm current monthly rents for every unit (ask for leases, not verbal estimates).
- Multiply total monthly rent by 12 to get annual gross rent.
- Divide listing price by annual gross rent.
- Compare the result to local market GRM comps for similar asset classes.
- If GRM is within your target range, proceed to NOI and rehab analysis. If not, pass.
Pro Tip: Always ask whether the seller’s quoted rents are current leases or projected market rents. Sellers sometimes inflate GRM attractiveness by using optimistic pro-forma rents rather than actual signed leases. Verify with rent rolls before you calculate.
What counts as a good GRM in your market
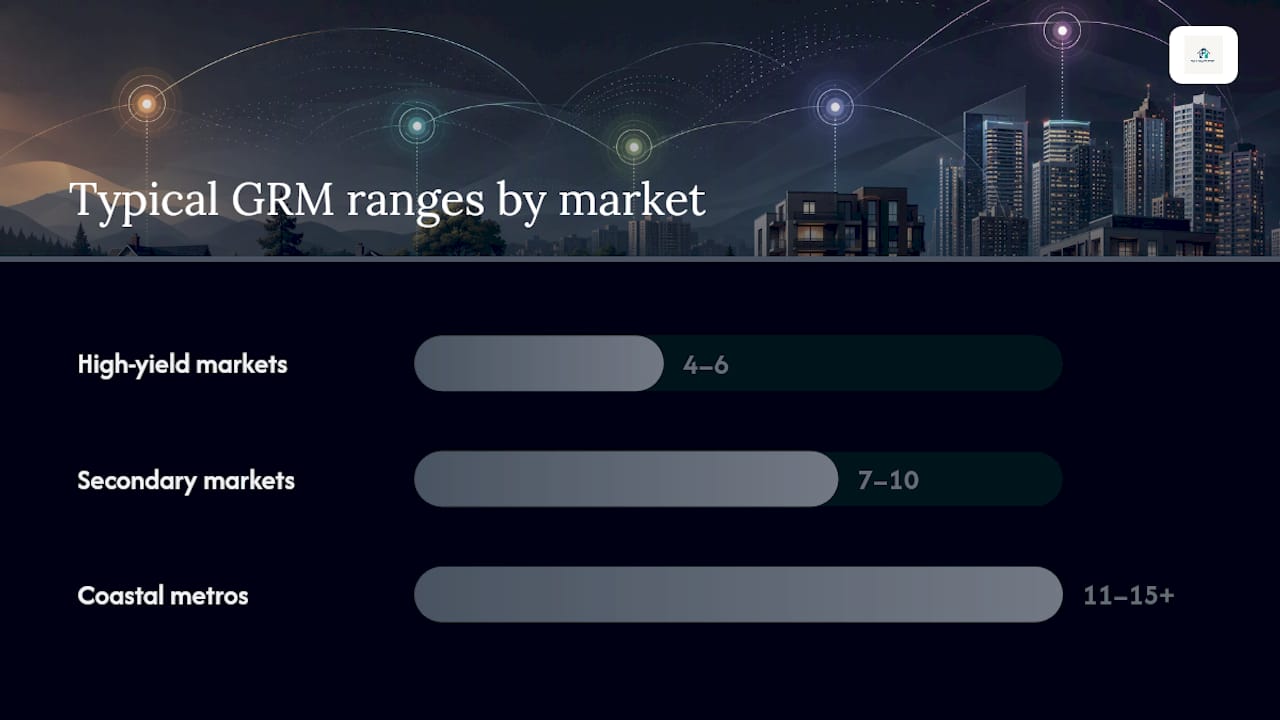
There is no universal “good” GRM. Practitioner resources show typical ranges vary widely by geography and asset class, generally falling somewhere between 4 and 12 for residential income properties, with coastal and high-appreciation markets often running higher.
What the ranges tend to signal:
- GRM of 4–6: Common in high-yield, lower-appreciation markets (parts of the Midwest and Southeast). Strong cash flow potential, but verify expenses carefully since older stock often carries higher maintenance loads.
- GRM of 7–10: Typical mid-range for secondary markets. Reasonable balance between income and price, though you need to confirm expense ratios before committing.
- GRM of 11–15+: Frequent in high-cost coastal metros (New York, San Francisco, Los Angeles). Lower immediate yield; investors are pricing in appreciation. Cash flow is often thin or negative at these levels.
Caveats worth keeping in mind:
- Asset class matters. A GRM of 8 on a Class C fourplex in a rust-belt city carries different risk than an 8 on a Class B property in a growing Sun Belt suburb.
- Local cap-rate environment anchors interpretation. In a market where cap rates run 5%, a GRM of 12 may be normal. In a 9% cap-rate market, a 12 GRM looks expensive.
- Appreciation expectations shift the calculus. Investors in high-GRM markets often accept lower current income in exchange for equity growth. BRRRR investors generally need lower GRMs because the strategy depends on cash flow to service debt after refinance.
- Compare within asset class. A GRM for a single-family rental is not directly comparable to one for a 20-unit apartment building.
For BRRRR specifically, a GRM that looks acceptable pre-rehab may look very different once you factor in post-renovation rents. Always recompute after estimating stabilized rents.
How GRM compares to cap rate and GIM
Understanding the differences helps you choose the right tool for each stage of analysis.
| Metric | Income basis | Expense adjustment | Best use case |
|---|---|---|---|
| GRM | Gross potential rent | None | Fast initial screening |
| Cap Rate | Net operating income (NOI) | Full operating expenses deducted | Valuation and refinance planning |
| GIM | Effective gross income (EGI) | Vacancy and credit loss only | Comparing properties with mixed income streams |
The core distinction: GRM uses gross rent and ignores expenses entirely. Cap rate uses NOI, which is gross income minus all operating expenses. That makes cap rate a far more accurate profitability measure, but it requires more data and more time to compute. Quicken Loans recommends using GRM and cap rate together for a fuller picture of profitability.
GIM is the metric most often confused with GRM. GIM may include ancillary income sources like laundry, parking, and storage fees, and it typically uses EGI rather than GPR. When a broker hands you a multiplier without specifying which income figure they used, ask. Mixing GPR-based and EGI-based multipliers across listings produces false comparisons. For deeper analysis of when each metric applies, the GRM vs. cap rate breakdown on Dealanalyzerai’s blog covers the tradeoffs in detail.
For BRRRR workflows:
- Use GRM at the screening stage to eliminate weak candidates fast.
- Switch to cap rate and NOI once you have a rehab estimate and stabilized rent projection.
- Use net operating income analysis to confirm the deal works after refinance.
Limitations and common pitfalls of GRM
GRM is a screening tool, not a valuation model. Treating it as the latter is where investors get hurt.
The main pitfalls are:
- Expenses are invisible. A property with a GRM of 7 and 45% expense ratio can underperform a GRM-10 property with a 30% expense ratio. You cannot see this in the GRM alone.
- Vacancy is ignored. GPR assumes 100% occupancy. A building with chronic 15% vacancy has a real income stream that is materially lower than the GRM implies.
- Rehab needs are not reflected. A distressed property may show an attractive GRM based on current below-market rents, but the cost to bring it to market condition can eliminate any advantage.
- Income basis mixing. Sellers sometimes use GPR; conservative buyers should use EGI. Comparing a seller’s GPR-based GRM to a market EGI-based GRM makes the deal look better than it is.
- Financing is excluded. Two investors with different leverage levels will experience the same GRM property very differently. GRM says nothing about debt service coverage.
- Market comparability. GRM only means something relative to local comps. A GRM of 9 is not inherently good or bad without knowing what similar properties in the same submarket trade at.
The practical fix: use GRM to prioritize which listings to model fully, then run a rental cash flow analysis to confirm the numbers hold up once expenses, vacancy, and financing enter the picture.
How to apply GRM when evaluating BRRRR deals
The BRRRR strategy (Buy, Rehab, Rent, Refinance, Repeat) has a specific sequence, and GRM fits into it at two distinct points: initial acquisition screening and post-rehab refinance planning.
The BRRRR stages where GRM matters:
- Buy: Screen candidates with pre-rehab GRM to eliminate obvious misses before spending time on site visits or contractor bids.
- Rehab: Estimate post-renovation market rents and recompute GRM using those stabilized figures.
- Rent: Confirm actual rents achieved match your projections. Recalculate GRM with real lease data.
- Refinance: Lenders underwrite on NOI and DSCR, not GRM. But your post-rehab GRM signals whether the property will likely clear lender income thresholds. A post-rehab GRM that aligns with local market norms suggests the appraisal and income underwriting will support your target loan amount.
- Repeat: Use the GRM benchmark you established on this deal to screen the next one faster.
Worked BRRRR example:
A distressed fourplex is listed at $180,000. Current rents are $500 per unit per month.
- Pre-rehab annual rent: $500 × 4 × 12 = $24,000
- Pre-rehab GRM: $180,000 ÷ $24,000 = 7.5
After a $40,000 rehab, market rents rise to $800 per unit.
- Post-rehab annual rent: $800 × 4 × 12 = $38,400
- ARV (estimated): $280,000
- Post-rehab GRM: $280,000 ÷ $38,400 = 7.3
The post-rehab GRM of 7.3 aligns with local market comps. That alignment suggests a lender appraisal will support a refinance near ARV, allowing you to pull out equity and repeat. For ARV calculation methods that feed directly into this analysis, Dealanalyzerai’s blog covers the main approaches.
Your maximum allowable offer (MAO) works backward from the ARV and rehab budget. If you need to buy at a price that produces a post-rehab GRM at or below local market norms, you can reverse the formula: Max Price = Target GRM × Post-Rehab Annual Rent, then subtract rehab costs and your required profit margin.

Pro Tip: Lenders underwriting a BRRRR refinance focus on DSCR and LTV, not GRM directly. But a post-rehab GRM that matches local market comps is a reliable proxy for whether the income will support the appraiser’s value conclusion. If your GRM is well above market, the appraisal may come in below your ARV target, limiting how much equity you can pull.
Quick GRM cheat-sheet for deal screening
Formula: GRM = Property Price ÷ (Monthly Rent × 12)
Screening steps:
- Confirm listing price (not assessed value).
- Collect current signed leases for all units.
- Multiply total monthly rent by 12.
- Divide price by annual rent.
- Compare to local market GRM comps for the same asset class.
- If pre-rehab GRM passes, estimate post-rehab rents and recompute.
Red flags that require deeper analysis before proceeding:
- Seller quotes projected rents, not current leases.
- GRM is significantly below local comps (may signal hidden expenses or deferred maintenance).
- GRM is based on a mix of residential and commercial income without separation.
- Post-rehab GRM exceeds local market norms even with optimistic rent assumptions.
- No vacancy adjustment was applied to the income figure used.
For a broader property evaluation workflow that puts GRM in context with other screening metrics, Dealanalyzerai’s blog covers the full process.
GRM is a starting line, not a finish line
GRM earns its place in every investor’s toolkit precisely because it is fast. You can screen 20 listings in the time it takes to run a full NOI analysis on one. That speed advantage is real, and BRRRR investors who are evaluating multiple deals weekly cannot afford to skip it.
But the metric’s simplicity is also its ceiling. Gross rent tells you nothing about what it costs to operate the property, how reliable the tenants are, or whether the building needs a new roof. Two deals with identical GRMs can produce wildly different cash-on-cash returns once expenses enter the picture.
The investors who use GRM most effectively treat it as a gate, not a grade. Pass the GRM screen, then run the full analysis. Fail it, move on without regret. That discipline keeps deal flow moving without letting a single attractive-looking multiple pull you into a money-losing acquisition. The BRRRR deal metrics that matter most after GRM, including DSCR and cash-on-cash return, are where the real underwriting happens.
One more thing worth saying plainly: the income basis problem is the most common GRM mistake active investors make. Sellers and brokers routinely present GPR-based multipliers. Buyers who compare those against EGI-based market comps will consistently overpay. Verify which income figure is in the denominator every single time before you trust a GRM number someone else calculated.
Dealanalyzerai cuts your GRM screening time significantly
Screening deals manually means toggling between spreadsheets, MLS data, and rent comps. Dealanalyzerai replaces that process with an AI-powered analysis that calculates GRM, estimates ARV, flags rehab costs from uploaded property photos, and outputs a maximum allowable offer in one workflow.

For BRRRR investors, the platform’s BRRRR calculator models pre-rehab and post-rehab GRM side by side, so you can see immediately whether a deal clears your refinance targets. The rehab cost estimator feeds directly into that projection, removing the guesswork from post-renovation rent assumptions. The full deal analyzer also generates professional property reports you can share with lenders or partners. Run your next BRRRR candidate through the free analysis tool and see where it stands before you make an offer.
Sources
- Gross rent multiplier
- Gross rent multiplier (GRM) | Wall Street Prep
- Gross Rent Multiplier (GRM) - Overview, Formula, Examples | CFI
This article is general information, not a substitute for advice from a qualified financial advisor. Consult a qualified financial professional about your own circumstances before acting on anything here.
FAQ
What is a good gross rent multiplier?
A GRM between 4 and 10 is generally considered favorable for residential income properties in the United States, though the right benchmark depends on your local market and asset class. High-cost coastal markets routinely trade at GRMs of 12 or higher, where investors are pricing in appreciation rather than current cash flow.
Is a GRM of 12 good?
Higher GRMs can be acceptable in high-appreciation markets like major coastal metros, but they typically signal thinner cash flow. For BRRRR investors who need post-refinance cash flow to service debt, higher GRMs warrant careful NOI analysis before proceeding.
What is a drawback of using GRM?
GRM ignores operating expenses, vacancy, and financing costs entirely. Two properties with the same GRM can produce very different returns once taxes, insurance, maintenance, and debt service are factored in, which is why GRM should always be followed by a full cash flow analysis.
What is the 2% rule for rentals?
markets today.
Recommended
Analyze Your Next Deal with AI
Get an instant ARV estimate, rehab cost analysis, and deal score — free for 7 days.
Get Free Deal Breakdown