The Real Estate 1 Percent Rule: 2026 Investor Guide
Discover the real estate 1 percent rule to quickly evaluate investment properties. Learn how to filter potential deals effectively.
By DealAnalyzerAI Editorial Team
Real estate investing education and deal-analysis research from DealAnalyzerAI.

The Real Estate 1 Percent Rule: 2026 Investor Guide
The real estate 1 percent rule is a fast screening heuristic: monthly rent should equal at least 1% of the total purchase price (including repairs) before a property earns a deeper look. It is not a buy/no-buy verdict, and it does not guarantee cash flow. Think of it as a filter that eliminates obvious losers in seconds, so you spend your underwriting time on deals that actually have a shot.
The formula is simple: Monthly Rent ≥ 0.01 × (Purchase Price + Immediate Repairs). A property of moderate cost with typical repair needs must rent for an amount slightly above 1% of its total cost to pass. In lower-cost Midwest and Southeast secondary markets, that threshold is still achievable. In coastal metros like Los Angeles or Seattle, it is almost never realistic, which means the rule is a poor primary filter there. Because home prices have outpaced rents nationally, many U.S. markets no longer meet the 1% threshold, and the rule works best as an initial triage step rather than a standalone decision.
Use these quick triage thresholds before going any further: skip properties below 0.5%, scrutinize the 0.5–0.8% range carefully, investigate 0.8–1.0% deals, and prioritize anything above 1% for full underwriting.
Table of Contents
- How to calculate the 1 percent rule (with a worked example)
- What the 1% rule tells you and the blind spots it misses
- How the 1% rule compares with the 2% rule, cap rate, and other metrics
- How to use the 1% rule in a practical screening workflow
- Where the 1% rule realistically works in U.S. markets
- Full worked underwriting example: from 1% screen to buy/no-buy
- Tools and calculators that put the 1% rule to work
- Key Takeaways
- The 1% rule is a starting point, not a finish line
- Dealanalyzerai runs the full workflow, from screen to underwriting
- Useful sources
- FAQ
How to calculate the 1 percent rule (with a worked example)
The most common mistake investors make is applying the rule to the purchase price alone and ignoring renovation costs. That inflates the apparent yield and sets you up for a deal that looks good on paper but bleeds cash from day one.
The correct formula:
Monthly Rent ≥ 0.01 × (Purchase Price + Repair Costs + Closing Costs)
What to include in your base:
- Purchase price
- Estimated immediate repairs and deferred maintenance
- Closing costs (typically 2–5% of the purchase price)
- Any required capital improvements before the unit is rentable
What to leave out at the screening stage:
- Long-term appreciation assumptions
- Future rent increases
- Tax benefits or depreciation
Worked example:
A single-family rental in a Midwest secondary market lists at $120,000. The inspection reveals $15,000 in needed repairs (roof, HVAC, flooring). Closing costs run $3,600.

| Line Item | Amount |
|---|---|
| Purchase price | $120,000 |
| Repairs | $15,000 |
| Closing costs | $3,600 |
| Total all-in cost | $138,600 |
If local rent comps roughly meet the rent threshold calculated from total costs, the deal passes the screen; if they are notably lower, it fails and you move on. Freedom Mortgage explicitly advises applying the rule to total cost rather than the sticker price, and that single adjustment changes the verdict on a surprising number of deals.
What the 1% rule tells you and the blind spots it misses
What it cannot see
- Property taxes (which vary wildly by county and state)
- Landlord insurance premiums
- Vacancy and credit loss
- Property management fees (typically 8–12% of gross rent)
- HOA dues and restrictions
- Ongoing maintenance and repairs
- Capital expenditure reserves (roof, HVAC, water heater)
- Financing costs and interest rate sensitivity
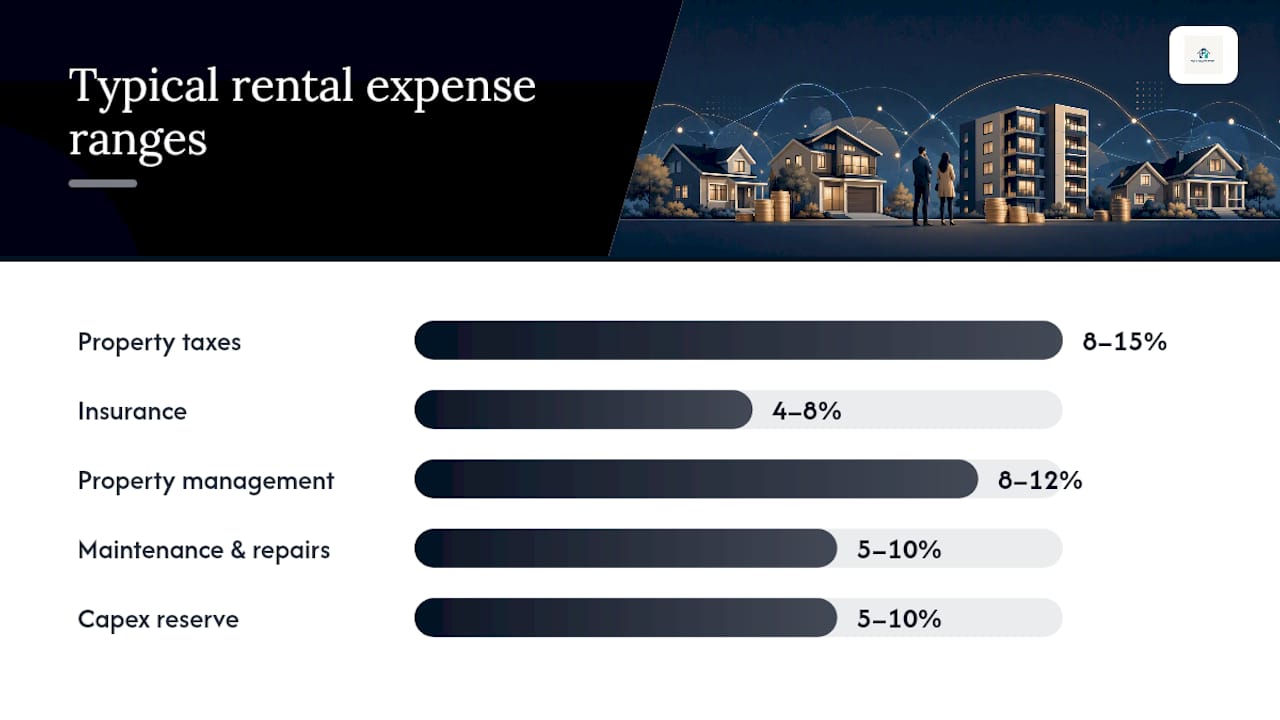
Passing the 1% screen means a deal is worth investigating, not worth buying. The table below shows the ongoing costs you must model after the screen to understand actual cash flow.
| Expense Category | Typical Range (% of Gross Rent) |
|---|---|
| Property taxes | 8–15% |
| Insurance | 4–8% |
| Property management | 8–12% |
| Maintenance and repairs | 5–10% |
| Capital expenditure reserve | 5–10% |
| Vacancy allowance | 5–8% |
The 50% rule is a useful second-step heuristic: assume operating expenses consume roughly half of gross rent. If a property passes the 1% screen, run the 50% rule next to estimate net operating income (NOI) before touching a full spreadsheet.
Pro Tip: If you plan to use a property manager, raise your personal threshold to 1.1–1.2%. At current interest rates, a bare 1% pass with professional management often produces flat or negative cash flow once all expenses are modeled.
How the 1% rule compares with the 2% rule, cap rate, and other metrics
Each heuristic answers a different question. Knowing which one to reach for at each stage of your workflow keeps you from misapplying any of them.
- 1% rule. Monthly rent ÷ all-in cost ≥ 1%. Answers: “Is this worth a second look?” Fast triage only.
- 2% rule. Monthly rent ÷ purchase price ≥ 2%. A stricter version of the same screen. The 2% rule is rarely achievable in most U.S. markets today and is most relevant in very low-cost markets or distressed properties. It does not account for operating expenses any more than the 1% rule does.
- Cap rate. NOI ÷ property value. Answers: “What is this asset worth as an income producer, independent of financing?” Used at the underwriting stage to compare deals and assess market pricing.
- Cash-on-cash return. Annual pre-tax cash flow ÷ total cash invested. Answers: “What am I actually earning on the dollars I put in?” The most financing-sensitive metric and the one that changes most dramatically with interest rate shifts.
- Gross Rent Multiplier (GRM). Purchase price ÷ annual gross rent. Answers: “How many years of gross rent does this cost?” A quick valuation check, not an expense-aware metric.
- 70% rule. Maximum Allowable Offer (MAO) = (ARV × 0.70) minus repair costs. Answers: “What is the most I should pay on a fix-and-flip?” Primarily a wholesaler and flipper tool, though rental investors use it to set offer ceilings on distressed properties.
Mini example using the same $138,600 all-in property renting for $1,400/month:
| Metric | Calculation | Result |
|---|---|---|
| 1% rule | $1,400 ÷ $138,600 | 1.01% (passes) |
| 2% rule | $1,400 ÷ $138,600 | 1.01% (fails) |
| GRM | $138,600 ÷ $8,400 | 8.25 |
| Cap rate (est. NOI $10,164) | $10,164 ÷ $138,600 | 7.3% |
| Cash-on-cash (30% down, 7% rate) | $1,656 ÷ $41,580 | 3.98% |
Both the 1% and 2% rules are rules of thumb that should be used alongside cap rate, cash-on-cash, and detailed expense modeling, not instead of them. The 1% rule gets you to the right deals faster; the other metrics tell you whether to actually buy.
How to use the 1% rule in a practical screening workflow
Run this checklist for every listing before committing time to a full underwriting analysis.
- Calculate all-in cost. Add purchase price, estimated repairs, and closing costs. Use the rehab cost estimator or a conservative per-square-foot estimate if you have not yet done a walkthrough.
- Pull rent comps. Check at least three comparable active rentals within a half-mile radius. Confirm bed/bath count, condition, and amenities match. Do not rely on Zestimate rent estimates alone.
- Apply the 1% threshold. Divide estimated monthly rent by all-in cost. Below 0.8%? Move on unless you have a specific value-add thesis. Above 1%? Proceed to step 4.
- Run the 50% expense estimate. Multiply gross monthly rent by 0.50 to estimate monthly operating expenses. Subtract from gross rent to get estimated NOI.
- Model your financing. Plug in your expected down payment, loan amount, and current interest rate to calculate monthly debt service. Subtract from estimated NOI to get estimated monthly cash flow.
- Test two rate scenarios. Run the same calculation at your current rate and at a rate 1.5 points higher. If the deal goes negative in the higher-rate scenario, note it as a risk factor.
- Check for red flags. Before scheduling a showing, verify the items below.
Red flags that stop a deal without deeper digging:
- Property taxes above 2% of assessed value annually
- Flood zone designation requiring separate flood insurance
- Active HOA with rental restrictions or caps on investor ownership
- Structural issues visible in listing photos (foundation cracks, roof sag, water staining)
- Insurance market challenges in the county (common in parts of Florida and Louisiana)
- Rent-controlled jurisdiction that limits future rent increases
Questions to ask the listing agent or seller:
- What is the current rent, and when was it last increased?
- Are there any deferred maintenance items not reflected in the listing price?
- What have utilities and taxes run annually?
- Is the property in an HOA, and what are the rental rules?
For a deeper look at screening multiple properties efficiently, the workflow above scales well when you are running 10–20 deals per week.
Where the 1% rule realistically works in U.S. markets
The rule is a useful primary filter in specific market types. In others, it is almost never achievable and will cause you to dismiss every deal in the market, which is not useful either.
Markets where 1% is still realistic:
- Lower-cost Midwest metros: cities in Ohio, Indiana, Michigan, Missouri, and Kansas where median home prices remain below $200,000
- Secondary Southeast markets: parts of Alabama, Mississippi, Tennessee, and Arkansas outside the major metros
- Rural single-family markets with strong rental demand from local employment (manufacturing, agriculture, logistics)
- Small college towns with consistent tenant demand and lower acquisition costs
- Distressed or value-add properties in any market where the purchase price is significantly below ARV
Markets where 1% is rarely achievable:
- Coastal major metros: Los Angeles, San Francisco, Seattle, Boston, New York City, and Washington D.C.
- High-priced Sunbelt metros that have seen rapid appreciation: Austin, Nashville, Denver, Phoenix, and Charlotte
- Any market where the median home price exceeds $400,000 and rents have not kept pace
The gap between coastal and Midwest markets is not subtle. A $600,000 property in Los Angeles would need $6,000/month in rent to pass the 1% screen. The median rent for a comparable property in that market is a fraction of that figure. In contrast, a $130,000 property in a secondary Ohio market renting for $1,350/month clears the threshold comfortably.
Pro Tip: Use submarket filters on listing platforms to isolate zip codes by median price. In any major metro, there are often lower-cost suburban or exurban pockets where the 1% rule becomes achievable again. Do not write off an entire metro based on headline median prices.
Full worked underwriting example: from 1% screen to buy/no-buy
Start with the same property from the calculation section: $120,000 purchase price, $15,000 repairs, $3,600 closing costs, $138,600 all-in, $1,400/month estimated rent.
Step 1: Confirm the 1% screen $1,400 ÷ $138,600 = 1.01%. The deal passes.
Step 2: Estimate NOI
| Income/Expense | Monthly | Annual |
|---|---|---|
| Gross rent | $1,400 | $10,164 |
| Net Operating Income (NOI) | $847 | $10,164 |
Step 3: Calculate cap rate Cap Rate = $10,164 ÷ $138,600 = 7.3%. A 7%+ cap rate in a secondary market is a reasonable result.
Step 4: Model debt service and cash-on-cash
Assume 25% down ($34,650), loan of $103,950 at 7.25% for 30 years. Monthly payment: approximately $709.
Monthly cash flow: $847 (NOI) minus $709 (debt service) = $138/month. Annual cash flow: $1,656. Cash-on-cash return: $1,656 ÷ $41,580 (cash invested including down payment and closing) = 3.98%.

Step 5: Run sensitivity scenarios
| Scenario | Rate | Monthly Payment | Monthly Cash Flow | Cash-on-Cash |
|---|---|---|---|---|
| Base case | 7.25% | $709 | $138 | 3.98% |
| Higher rate | 8.75% | $138 | $30 | 1.01% |
| Higher vacancy (12%) | 7.25% | $709 | 709 | 3.98% |
Verdict: The deal passes the 1% screen and produces a modest positive cash flow at base-case assumptions. At 8.75%, it is nearly break-even. This is a deal worth pursuing only if you have high confidence in the rent comp and the repair estimate. A full property analysis with verified ARV and a detailed rehab scope would be the logical next step before making an offer.
Interest-rate sensitivity is real: the same rent-to-price ratio produces materially different cash flow as mortgage rates change, which is why running multiple rate scenarios is not optional in 2026.
Tools and calculators that put the 1% rule to work
The screening workflow above is only as fast as the tools you use to run it. Here is how each tool type fits into the process.
- Rent-to-price quick calculator. A simple division tool you can run in seconds. Use it at the first pass to eliminate clear misses before pulling comps or running any other numbers. Understanding gross rental yield is the foundation of this step.
- Rental cash flow calculator. Models mortgage, taxes, insurance, management, and operating expenses to convert gross rent into NOI and cash-on-cash return. Use this after a deal passes the 1% screen.
- ARV estimator. Calculates after-repair value using comparable sales. Critical for distressed properties where the purchase price is well below market value. Dealanalyzerai’s ARV calculator uses AI-powered comp analysis to produce an ARV range quickly.
- Rehab cost estimator. Automates repair cost estimates from uploaded property photos and local cost data. Dealanalyzerai’s rehab cost estimator removes the guesswork from the all-in cost calculation, which is the number the 1% rule actually runs on.
- MAO/70% rule calculator. Sets the maximum allowable offer for distressed and value-add deals. Use the 70% rule calculator alongside the 1% screen when evaluating properties that need significant work.
The right sequence: quick 1% screen → rental cash flow model → ARV and rehab verification → full underwriting with sensitivity scenarios. Each tool handles one stage. Analyzing a rental property in 30 minutes is achievable when the tools are set up correctly.
Key Takeaways
The 1% rule is a fast screening filter, not a buy decision: passing it means a deal is worth underwriting, not worth buying without further analysis.
| Point | Details |
|---|---|
| Use all-in cost, not list price | Always include repairs and closing costs in the denominator to avoid overstating yield. |
| Triage thresholds matter | Skip below 0.5%, scrutinize 0.5–0.8%, investigate 0.8–1.0%, and prioritize above 1% for full underwriting. |
| Layer in NOI and cash-on-cash | After a 1% pass, model vacancy, management, taxes, and debt service to get real cash flow numbers. |
| Rate sensitivity changes everything | Run scenarios at your current rate and at least 1.5 points higher; a deal that barely passes at 7.25% may break even at 8.75%. |
| Dealanalyzerai accelerates the workflow | Use Dealanalyzerai’s ARV estimator, rehab cost calculator, and cash flow model to move from 1% screen to full underwriting in one platform. |
The 1% rule is a starting point, not a finish line
The investors who get burned by the 1% rule are not the ones who use it. They are the ones who stop there. The rule does exactly one thing well: it tells you which deals are not obviously terrible. That is genuinely useful when you are sorting through 30 listings on a Tuesday morning. What it cannot do is tell you whether a deal actually cash flows after taxes, insurance, a vacancy month, and a water heater replacement in year two.
The more interesting question is what you do after a deal passes the screen. Most investors underestimate how much the financing environment changes the math. A property that looked like a solid 5% cash-on-cash return at a 5% mortgage rate can drop to near break-even at 7.25%, with the same rent and the same purchase price. That is not a flaw in the 1% rule. It is a reminder that the rule was designed for a different rate environment and needs to be paired with a full debt service calculation every single time.
The other thing experienced investors know: a deal that fails the 1% rule is not automatically dead. If property taxes are unusually low, if the market has strong appreciation fundamentals, or if there is a clear value-add play that lifts rents above the threshold after light renovation, the math can still work. The rule eliminates noise. It does not replace judgment.
Dealanalyzerai runs the full workflow, from screen to underwriting
Screening dozens of deals per week by hand is slow and inconsistent. Dealanalyzerai is built for active investors who need fast, repeatable analysis from the first 1% screen all the way through to a full underwriting decision.
The platform combines AI-powered ARV estimation, photo-based rehab cost analysis, and a complete cash flow model in one place. You get ARV ranges, maximum allowable offers, cap rate and cash-on-cash outputs, and risk flags, all without toggling between five different spreadsheets. For investors running high deal volume, the batch screening feature means you can triage an entire market segment in the time it used to take to underwrite one property.
Run your first deal analysis free at dealanalyzerai.com and see how fast the screen-to-underwriting workflow can move when the calculations are handled for you.
Useful sources
- The 1% rule in real estate: What to know before investing
- The 1% Rule in Real Estate, Explained
- The 1% Rule in Real Estate: When It Works and When It Fails | Galleon
- What’s the 1% Rule in Real Estate?
- What Is the 2% Rule in Real Estate? Pros, Cons, & How to Use
- What Is the 2% Rule in Real Estate? Pros, Cons, & How to Use
- Noob question - is the 1% rent rule unrealistically simplistic?
FAQ
Is the 1% rule in real estate realistic in 2026?
In lower-cost Midwest and secondary Southeast markets, yes. In coastal metros and high-priced Sunbelt cities, the rule is rarely achievable and is not a useful primary filter for those markets.
What is the 2% rule in real estate?
The 2% rule is a stricter version of the same heuristic: monthly rent should equal at least 2% of the purchase price. It is almost never achievable in today’s U.S. markets and is most relevant for deeply discounted or distressed properties.
Does the 1% rule still apply today?
It still works as a fast screening filter, but passing it is a weaker signal than it was historically. At current interest rates, many investors target 1.1–1.2% to ensure positive cash flow after professional management and debt service are factored in.
Is the 1% rule outdated?
Not entirely. The rule remains a useful triage tool for eliminating obvious misses quickly, but it must be paired with NOI, cap rate, and cash-on-cash calculations before any offer is made. Treating it as a buy signal rather than a screening filter is where investors run into trouble.
What should I do after a property passes the 1% screen?
Run the 50% expense estimate to approximate NOI, model your debt service at current rates, test a higher-rate scenario, and verify rent comps with at least three active listings. Tools like Dealanalyzerai’s rental cash flow calculator handle this post-screen math automatically.
Recommended
Analyze Your Next Deal with AI
Get an instant ARV estimate, rehab cost analysis, and deal score — free for 7 days.
Get Free Deal Breakdown