Investors: Five Point Rental Demand Indicators Checklist
Investor focused checklist: five rental demand indicators, how to score them, and how to turn the score into price, buy, or hold decisions.
By DealAnalyzerAI Editorial Team
Real estate investing education and deal-analysis research from DealAnalyzerAI.

Investors: Five Point Rental Demand Indicators Checklist
The five indicators that matter most right now are the vacancy trend, effective rent (after concessions), lease velocity, local employment by industry, and near-term new supply from permits. No single metric tells the full story. Cross-check at least three of them before you price a unit or underwrite an offer, because a lease-up that looks strong on occupancy alone can still be bleeding revenue underneath.
TL;DR:
- Vacancy rates below 5% indicate a landlord-favorable market with strong pricing power, while rates above 10% suggest renters have leverage and concessions are likely.
- A comprehensive rental demand assessment should prioritize multiple indicators like vacancy trend, effective rent, lease velocity, local employment, and future supply, weighted appropriately.
- Rent growth prospects depend on local income levels, with affordability becoming strained if rent outpaces median household income or wages in lower segments stagnate.
- Policy restrictions such as rent control, zoning, and tenant laws can override market signals, making local regulation checks essential before making leasing or investment decisions.
Table of Contents
- What Are the Key Rental Demand Indicators, and What Does Each One Signal?
- Where to Find Reliable Rental Market Data (and How to Measure It)
- How to Read Multiple Indicators Together Without Getting Fooled
- A Five-Point Scoring Checklist for Rating Rental Demand
- Rental Affordability and Income Levels Set the Ceiling on Rent Growth
- How Interest Rates and Mortgage Access Shape Rental Demand
- Rental Demand Doesn’t Move the Same Way Across Property Types or Renter Groups
- Government Policy Can Override Every Other Indicator on This List
- How to Turn These Indicators Into a Forecast, Not Just a Snapshot
- An Investor’s Take on Reading These Signals
- Put These Indicators to Work With DealAnalyzerAI
- Sources
- FAQ
What Are the Key Rental Demand Indicators, and What Does Each One Signal?
Vacancy rate is the starting point, but the threshold shifts by market. A rate under 5% signals a landlord-favorable market with real pricing power. Between 5% and 8% is balanced. Above 10% usually means renters have leverage and concessions are coming. The national rental vacancy rate hit 7.3% in Q2 2026, with median asking rent for vacant units at $1,531, according to Census Bureau data. That national figure is a benchmark, not a forecast for your submarket. A metro at 4% vacancy and one at 9% are telling two entirely different stories.
Rent growth requires separating advertised rent from effective rent. Advertised rent is the number on the listing. Effective rent factors in concessions, and concessions have become a real force in the market. RealPage reported same-store effective asking rents up just 0.9% year-over-year even as occupancy sat near 95.5%, a gap that only makes sense once you account for what landlords are giving away to fill units.
- Occupancy vs. economic vacancy: a building can show 96% physical occupancy and still underperform if concessions, delinquencies, and below-market renewals are eating the revenue line.
- Lease velocity: track how many days comparable units sit before signing. Rising days-on-market ahead of any vacancy uptick is often the earliest warning sign.
- Search and lead indicators: Zillow research shows rising out-of-town search share often precedes relocation demand, which makes listing page views a genuine leading indicator rather than a vanity metric.
- Employment and wages: metro-level job trends matter more than national headlines, especially when one industry dominates the local base.
- New supply and permits: a wave of permits today becomes a wave of deliveries in 12 to 24 months, and that timing gap is where a lot of investors get caught flat-footed.
Concessions now cover 43.5% of 0 to 2 bedroom listings across the 50 largest metros, per Realtor.com’s August 2026 rent report, which also marked the 37th straight month of falling median asking rent nationally. If you’re only checking the asking-rent line on a listing site, you’re missing nearly half the real pricing picture.
Where to Find Reliable Rental Market Data (and How to Measure It)
You don’t need a research department to track this well. You need the right series and a consistent method.
- Census Bureau’s Housing Vacancies and Homeownership survey (HVS) and American Community Survey (ACS) for vacancy and homeownership rates. HVS releases quarterly; ACS gives you finer geography but on a slower annual cycle.
- BLS Local Area Unemployment Statistics (LAUS) and Current Employment Statistics (CES) for metro-level job counts by industry. Pull the monthly employment release and drill into your specific metro rather than trusting the national headline number.
- FRED’s permit series, including PERMITNSA, for a running count of authorized housing units. This is your best early read on the supply pipeline before deliveries hit the market.
- RealPage and similar platform analytics for effective rent, occupancy, and concession trends at the property and submarket level.
- Realtor.com and Zillow for asking-rent trends, concession share, and search-based demand signals.
To calculate effective rent by hand, take the advertised rent, subtract the monthly value of any concession (say, one month free spread across a 12-month lease equals roughly 8.3% off), and compare that number month over month, not just against last year’s listing.
Pro Tip: Always match your geography to your actual renter pool. A ZIP code average can hide a 15-point vacancy swing between the north and south side of the same town. Pull county or submarket data whenever it’s available instead of leaning on metro-wide averages.
How to Read Multiple Indicators Together Without Getting Fooled
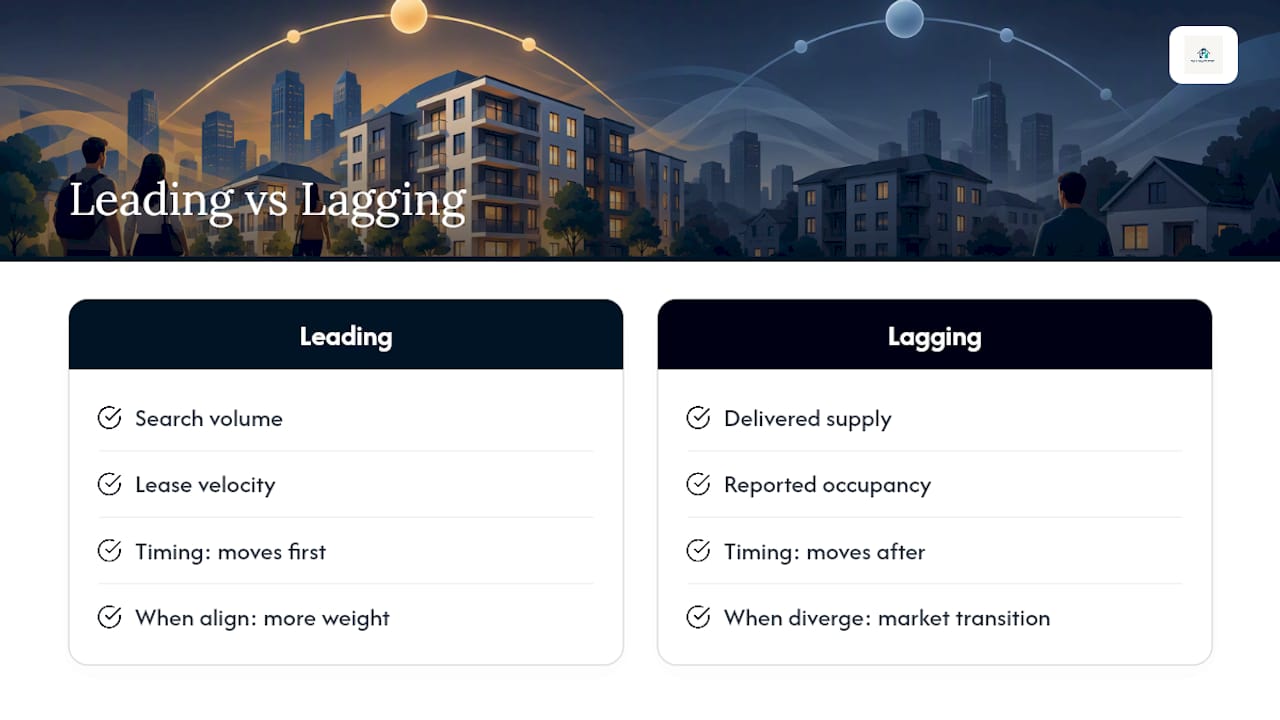
Some indicators lead the market. Search volume and lease velocity tend to shift first, often weeks or months before vacancy or occupancy data catches up. Delivered supply and reported occupancy are lagging indicators. By the time a vacancy report reflects softness, the underlying cause may already be resolving or worsening further.
Seasonality trips up more investors than any single economic factor. Rentsync’s national demand analysis points out that late-summer dips are normal and shouldn’t be read as structural weakness on their own. Compare the same month year-over-year and use a rolling three-month average before you change pricing.
- Falling asking rent combined with low vacancy usually points to rising concessions, not falling demand. Renters are still there, just with more negotiating leverage.
- Strong occupancy paired with weak collected rent almost always means the property is running high delinquency or overly generous concessions. That’s an economic vacancy problem, not a demand problem.
- A permit surge in your submarket today is a signal to stress-test your rent-growth assumptions 18 months out, not this quarter.
- Local employment concentrated in a single volatile sector (hospitality, tech, energy) deserves a discount on your demand confidence, even if the headline job numbers look fine.
A Five-Point Scoring Checklist for Rating Rental Demand
Turn these signals into a decision, not just a folder of charts. Score each factor on a simple 1 to 5 scale, then weight it.
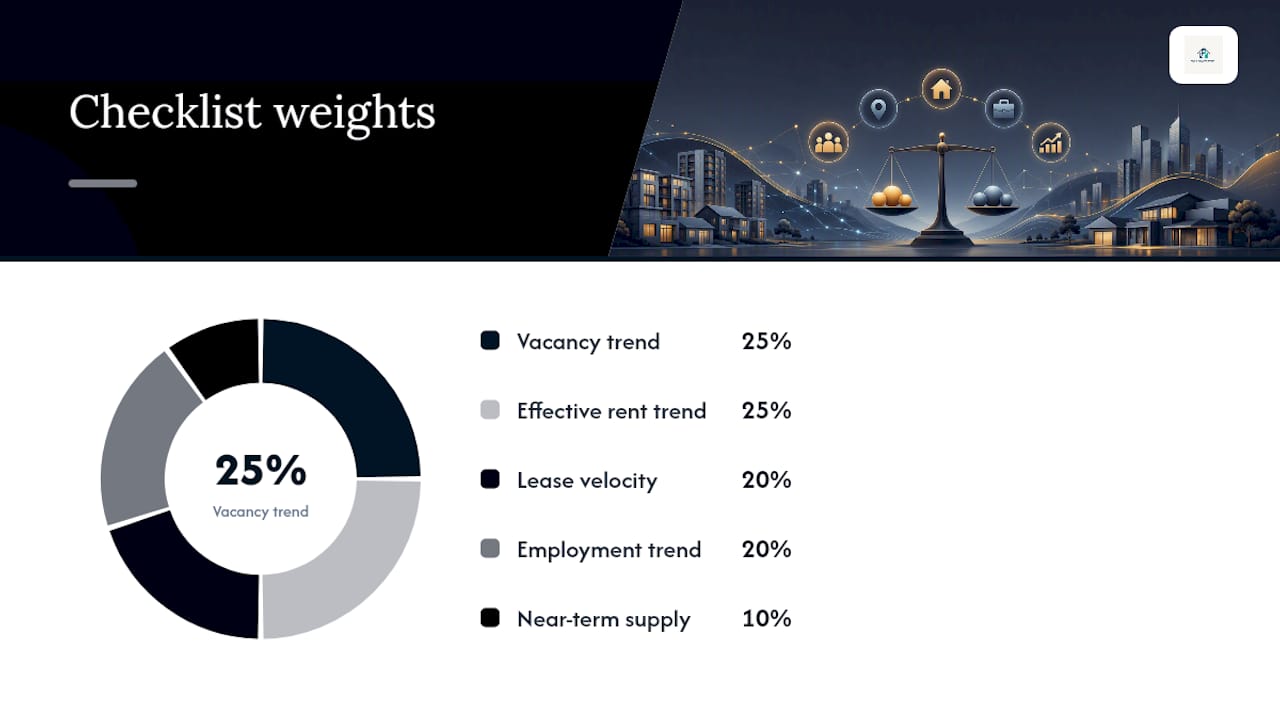
- Vacancy trend, 3 to 6 month window (weight 25%): tightening trend scores high; a rising trend over two consecutive quarters scores low regardless of the absolute number.
- Effective rent trend, 3 to 12 month window (weight 25%): rising effective rent, net of concessions, scores high.
- Lease velocity change (weight 20%): faster time-to-lease than three months ago scores high.
- Local employment trend, 12 month window (weight 20%): job growth concentrated across multiple industries scores higher than growth tied to one employer or sector.
- Near-term supply, permits and deliveries in 12 to 18 months (weight 10%): heavy pipeline relative to current inventory pulls the score down even when everything else looks strong.
A composite score above 4.0 supports pricing at or above market rate. Between 3.0 and 4.0, price to compete and hold rent flat. Below 3.0, expect to lean on concessions or delay a rent increase. Say a submarket shows improving lease velocity and flat vacancy, but a large permit wave lands in the FRED data for delivery in month 14. The composite score should drop even though today’s numbers look fine, because that supply is coming whether the market is ready or not.
Before finalizing an offer or a rent number, reconcile these market-level signals against your own property-level cash flow. DealAnalyzerAI’s AI-driven ARV ranges, photo-based rehab cost estimation, and maximum allowable offer calculations let you combine these market indicators with deal-level math and flag risk before you ever make an offer.
Pro Tip: Run the checklist quarterly, not annually. Rental demand shifts faster than most investors update their assumptions, and a stale score is worse than no score at all.
Rental Affordability and Income Levels Set the Ceiling on Rent Growth
Rent can only rise as fast as local incomes allow, which is why affordability metrics belong in every demand assessment.
Median household income by metro, available through the ACS, gives you the denominator. Compare it against the median asking rent for the unit type you’re targeting. A market where rents have outpaced income growth for several consecutive years is a market where demand looks artificially strong until renters simply can’t stretch further. That’s often what sits behind rising concession share even in metros with tight vacancy. Landlords can’t raise the number on the sign, so they cut the effective cost instead.
Income growth concentrated in a narrow band of high earners can also distort a metro average. A market with strong median income growth but stagnant wages in the bottom half will show affordability strain in workforce housing even while luxury product performs fine. Segment your affordability check by the price point you actually own or plan to buy, not the metro-wide median.
How Interest Rates and Mortgage Access Shape Rental Demand
Mortgage rates and lending standards push renters toward or away from homeownership, and that flow directly affects your applicant pool. When rates climb and mortgage approval gets harder, would-be buyers stay in rentals longer, adding demand to the exact unit types that compete with entry-level homes: three-bedroom houses and larger apartments.
The reverse holds too. When rates ease and lending loosens, some of your best long-term tenants, the ones saving for a down payment, exit into homeownership. That shows up first in your renewal rate before it ever shows up in a vacancy report, which makes renewal tracking a useful early-warning system on its own.
Rate moves also affect your competition on the supply side. Higher borrowing costs slow new construction starts, which tightens future supply and supports rent growth two or three years out, even if it dampens investor purchase activity today. Lower rates do the opposite: more development gets financed, and that pipeline eventually shows up in the permit data covered earlier.
Watch mortgage rate trends alongside your local employment and affordability numbers together, not in isolation. A metro with falling rates, rising income, and tight for-sale inventory can still hold rental demand steady, because renters simply can’t find a house to buy even when they’re financially ready to leave.
Rental Demand Doesn’t Move the Same Way Across Property Types or Renter Groups
A single metro-wide vacancy number hides real differences between property types. Class A high-rise apartments, garden-style Class B and C communities, single-family rentals, and small multifamily each respond to different demand pressures, and mixing them into one blended average will mislead your pricing.
Single-family rentals tend to draw families and longer-tenure renters, and demand there correlates more closely with school quality, commute times, and the for-sale housing market than with metro job counts. Class A apartments respond fastest to employment shifts in professional and tech sectors since that’s the renter base most likely to sign those leases. Workforce housing, meanwhile, tracks affordability and hourly-wage employment more tightly than any other segment.
Demographics matter just as much as property type. Renter households headed by someone under 35 tend to prioritize commute time and amenities. Households over 55 downsizing from homeownership often prioritize single-level layouts and lower-maintenance units, and that segment has grown as a share of the renter pool in many metros. Immigration and out-of-metro relocation, the same search-based signal covered earlier, skews heavily toward specific property types and price points depending on the origin market.
When you’re scoring demand for a specific acquisition, pull your indicators for that property type and price band specifically. A metro showing soft Class A absorption can sit right next to a workforce-housing submarket running near full occupancy with a waiting list.
Government Policy Can Override Every Other Indicator on This List
Rent control, eviction moratoriums, and zoning rules can flip a strong demand signal into a weak investment overnight, and no vacancy or employment number will warn you in advance. These policies vary enormously by state and even by city within the same metro, so check local rules before you rely on any market-level indicator to justify a rent increase or a purchase.
Rent stabilization ordinances cap how much you can raise rent annually regardless of what the market indicators say, which means a submarket showing strong effective rent growth in the data may not translate into revenue growth on a specific stabilized property. Zoning changes work the opposite direction. Upzoning that allows higher density can flood a submarket with new supply faster than the permit data alone suggests, since some jurisdictions fast-track approvals in designated growth corridors.
Tenant protection laws, including notice periods for rent increases and just-cause eviction requirements, extend your effective vacancy period when you do need to turn a unit. That’s an operational cost that market indicators won’t capture, but it changes your actual achievable rent growth. Property tax policy matters too. A jurisdiction reassessing property values aggressively can erode net operating income even while gross rent climbs, since the expense side moves independently of the demand-side indicators you’re tracking.
Before underwriting any acquisition, confirm the specific local and state regulations that apply to that property, not just the general reputation of the metro.
How to Turn These Indicators Into a Forecast, Not Just a Snapshot
A single data point tells you where the market stands today. A trend line, built from consistent monthly or quarterly pulls, tells you where it’s headed, and that’s the difference between reacting to the market and getting ahead of it.
Build a rolling dashboard rather than checking indicators once and filing the report away. Pull vacancy, effective rent, and lease velocity on the same schedule every month, and plot each against its own trailing twelve-month average. A single month of softness against a strong trailing average is noise. Three consecutive months moving the same direction is a trend worth acting on.
Layer in the leading indicators, search volume and lease velocity, ahead of the lagging ones, delivered supply and reported occupancy, and give more forecasting weight to whichever direction both are pointing simultaneously. When leading and lagging indicators agree, the forecast confidence is high. When they diverge, for example rising search interest against rising vacancy, that’s usually a sign of a market in transition, not a stable trend in either direction.
Scenario testing beats point forecasting for most investment decisions. Model your rent and occupancy assumptions under a base case, a case where the permit pipeline delivers on schedule, and a case where local employment softens by a moderate margin. If your deal still cash flows under the weaker scenario, you’ve built in real margin for error rather than betting on the best-case trend line holding.
An Investor’s Take on Reading These Signals
I weight rent growth, lease velocity, and local employment above any single vacancy snapshot. Vacancy is useful, but it lags. Reconcile every market signal against actual property-level cash flow before you trust it, and use rolling averages, not one data point, to make a call.
— Sam
Put These Indicators to Work With DealAnalyzerAI
Reading rent trends and vacancy data is only half the job. The harder part is turning those signals into a real number for a specific property, which is where most investors lose hours to guesswork. Dealanalyzerai gives you AI-generated ARV ranges, photo-based rehab cost estimates, and maximum allowable offer calculations built to combine local market signals with deal-level math, and it flags risk before you commit to an offer instead of after.
Instead of manually reconciling vacancy trends, effective rent, and permit data against a spreadsheet every time a new property crosses your desk, run it through a tool built for exactly that screening volume. Check current pricing plans or start with the free analyzer on your next property and see how the ARV range and risk flags compare to your own read on the market.
Sources
- Housing Vacancies and Homeownership - Press Release
- August 2026 Data Update
- Employment Situation News Release - 2026 M08 Results
- Rental search patterns offer a window into where relocation demand may be heading
FAQ
What Is the 7% Rule for Rental Properties?
It’s a quick filter, not a substitute for checking actual vacancy, rent comps, and cash flow for the specific property.
What Is the 2% Rule for Rental Properties?
It’s an extremely conservative bar that’s rarely achievable in most metros today, so treat it as a stress test rather than a realistic acquisition target in most markets.
Is Rent Expected to Go Down in 2026?
National asking rent has already fallen for 37 straight months as of the August 2026 Realtor.com report, driven largely by rising concessions rather than a collapse in demand. Whether rent keeps softening in your specific market depends on local vacancy, permit activity, and employment trends, not the national average alone.
What Is the 30% Rule for Rent?
When asking rents in a submarket push past that ratio for the local median income, expect rising delinquency and longer vacancy even if the posted vacancy rate still looks tight.
How Do I Combine These Indicators Into One Deal Decision?
Score vacancy trend, effective rent trend, lease velocity, local employment, and near-term supply on a simple weighted scale, then check the composite against your property-level cash flow. Tools like DealAnalyzerAI’s deal analyzer can speed that reconciliation by pairing market signals with AI-generated ARV ranges and offer calculations.
Recommended
Analyze Your Next Deal with AI
Get an instant ARV estimate, rehab cost analysis, and deal score — free for 7 days.
Get Free Deal Breakdown