Estimating ARV: A Practical Guide for Fix-and-Flip Investors
Master estimating ARV with three easy steps! Accurately assess your property's after-repair value to maximize profits in fix-and-flip investments.
By DealAnalyzerAI Editorial Team
Real estate investing education and deal-analysis research from DealAnalyzerAI.

Estimating ARV: A Practical Guide for Fix-and-Flip Investors
After-repair value (ARV) is the price your property will realistically sell for once renovations are complete. Estimating ARV accurately is the single most important calculation in any fix-and-flip deal, and you can build a defensible number with three steps:
- Run a comps-based CMA. Pull 4–6 closed comparable sales within 0.5 miles and 90 days. Average their adjusted prices to produce your ARV baseline.
- Estimate rehab value and costs. Build a line-item scope of work (SOW), get contractor bids, and add a 10–20% contingency for unknowns.
- Cross-check with price per square foot (PPSF) and a cost approach. Validate your comp-derived ARV against the neighborhood’s PPSF range and, for unique properties, a replacement-cost estimate.
Quick example: four comps average a mid-$170,000s value after adjustments. Your ARV is near that amount. Apply the 70% rule with your repair estimate to calculate your maximum allowable offer (MAO).
Pro Tip: Always underwrite to a conservative ARV, not your best-case comp. If your range runs $193,000–$213,000, build your MAO on $193,000. The upside takes care of itself; the downside can sink the deal.

Table of Contents
- How do you calculate ARV step by step?
- How do you find and select the right comps?
- How should you estimate rehab and repair costs?
- What cross-checks validate your ARV estimate?
- What are the 70% rule and other investor rules of thumb?
- Common mistakes investors make when estimating ARV
- Which tools help you estimate ARV faster and more accurately?
- Worked example: from comps to ARV to MAO
- Key Takeaways
- An investor-analyst’s take on tightening ARV estimates
- Dealanalyzerai cuts the time from deal to defensible offer
- Useful sources and further reading
- FAQ
How do you calculate ARV step by step?
A lender-grade ARV build follows a structured sequence. Skipping steps produces a number that won’t survive lender scrutiny or a market correction.
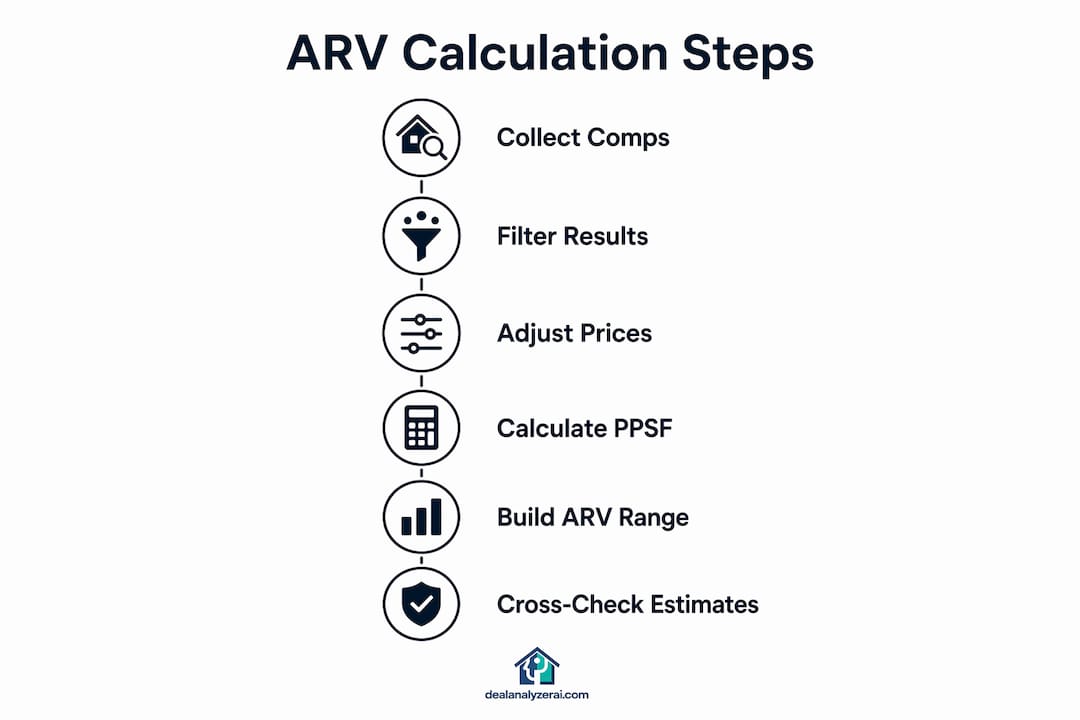
Step 1: Collect and filter comparable sales
Start with MLS closed sales as your primary source. Consumer portals like Zillow and Redfin are useful for a quick scan, but always verify close prices against MLS or public-record data before using them in your analysis.
Filter criteria:
- Time window: 90 days preferred; extend to 120 days in slower markets.
- Proximity: 0.25–0.5 miles in urban neighborhoods; up to 1–2 miles in suburban markets.
- Size: within ±15–20% of your subject property’s square footage.
- Condition: post-renovation or fully updated comps only. A comp sold “as-is” needs a condition adjustment.
- Style and age: match construction type (ranch, colonial, craftsman) and keep age within 10 years when possible.
Target 4–6 comps. Fewer than three makes your ARV statistically fragile.
Step 2: Adjust each comp for differences
No two properties are identical. Adjustments compensate for differences in square footage, bedroom/bath count, lot size, garage, condition, and special features. High-level adjustment ranges to guide your judgment:
| Feature Difference | Typical Adjustment Range |
|---|---|
| Per square foot (size gap) | $15–$125/sqft depending on market |
| Additional bedroom | $5,000–$15,000 |
| Additional full bath | — $15,000 |
| Garage (1-car vs. 2-car) | $5,000–$12,000 |
| Updated kitchen vs. standard | $10,000–$25,000 |
| Lot size premium (significant) | $5,000–$20,000+ |
These are judgment ranges, not formulas. Local appraisers in your market will have tighter figures, and calibrating against recent appraisals in the neighborhood sharpens your adjustments over time.
Step 3: Calculate PPSF and build your ARV range
Divide each comp’s adjusted sale price by its square footage to get price per square foot. Average those figures, then multiply by your subject property’s square footage.
Statistic callout: Practitioners warn that relying only on recent sales can mislead in shifting markets. PPSF cross-checks and the cost approach improve defensibility when market data is thin or volatile.
Produce three outputs: a low ARV (weakest comp, most conservative adjustments), a likely ARV (median-adjusted average), and a high ARV (strongest comp). Document every assumption. Lenders and partners will ask.
How do you find and select the right comps?
Quality comps are the foundation of any reliable after repair value analysis. A single bad comp can skew your ARV by $20,000 or more.
Primary source: MLS. Work with a licensed agent or broker who can pull closed sales directly. MLS data includes days on market (DOM), list-to-close price ratios, and concession notes that consumer portals strip out.
Supplement with public records. County assessor and recorder databases confirm close dates and prices independently. Cross-referencing catches data errors before they reach your underwriting.
Use closed sales only. Active listings show seller aspirations, not market reality. Pending sales can serve as supporting evidence for trend direction, but never as primary comps.
Here are six attributes to capture for every comp:
- Sale price and close date
- Square footage and price per square foot
- Bedroom and bathroom count
- Days on market
- Any price reductions before closing
- Notable condition notes or concessions
Pro Tip: Document each comp’s weaknesses alongside its strengths. A comp with 75 DOM and two price reductions tells a different story than one that closed in 12 days at list price. Those notes are your defense when a lender’s appraiser pushes back.
Handling special cases
Low-sales markets require expanding your search. When fewer than three comps exist within 90 days and 0.5 miles, expand the radius to 2–3 miles and extend the time window to 6–12 months, then validate with a replacement-cost cross-check. For rural or unique properties, this approach often produces a more defensible ARV than forcing distant comps.
Comps that sold with seller concessions (closing cost credits, rate buydowns) should be adjusted upward to reflect their true net price. Failing to do so understates your ARV.
How should you estimate rehab and repair costs?
Rehab cost estimation feeds directly into your MAO. Underestimate it and you overpay for the property. The goal is a line-item scope of work with a realistic contingency built in.
Start with a scope of work (SOW). Break the project into categories:
- Structural (foundation, framing, roof)
- Systems (HVAC, plumbing, electrical)
- Core rooms (kitchen, bathrooms)
- Cosmetic (paint, flooring, fixtures, landscaping)
- Exterior (siding, windows, driveway)
- Soft costs (permits, inspections, architectural drawings if needed)
Three estimating methods:
- Contractor bids. The most accurate method. Get at least two bids for every project. Bids expose scope gaps you missed and give you a real number to defend to lenders.
- Unit-cost/per-sqft models. Fast baseline for screening. Cosmetic rehabs often run $15–$30/sqft; moderate rehabs $30–$60/sqft; full gut renovations $75–$125/sqft or more depending on market and finishes.
- Photo-based AI estimates. Useful for scaling deal flow when you’re screening multiple properties weekly. AI tools analyze uploaded photos to flag condition issues and produce cost ranges before you invest time in a site visit.
Add a 10–20% contingency on top of your line-item total. Unseen structural issues, permit delays, and material cost swings are routine, not exceptions.
When a structural item changes the deal: A failing roof, foundation crack, or outdated electrical panel can shift a cosmetic flip into a full renovation. When that happens, recalculate your ARV assumptions from scratch. A property requiring a $40,000 foundation repair may need a different exit strategy entirely, such as a BRRRR hold rather than a quick flip.
What cross-checks validate your ARV estimate?
A single comp-based ARV is a starting point, not a final answer. Cross-checks catch overinflated estimates before they cost you money.
Price per square foot (PPSF) distribution. After computing PPSF for each comp, look at the spread. If one comp sits $40/sqft above the others, check its DOM and price history. Outliers with long DOM or multiple reductions often reflect aspirational pricing, not market reality. Use the median PPSF, not the mean, when outliers are present.
Cost approach / replacement cost. Add land value to the estimated cost of constructing a comparable structure, then subtract a buyer-preference discount. For unique or rural properties, replacement cost often yields a more defensible ARV than distant comps. A typical buyer discount for new-build preference runs 10–15%.
Professional appraisal. For deals above your normal ticket size or in thin-data markets, ordering an appraisal before closing is worth the cost. Appraisers apply standardized adjustment grids that lenders trust. Their adjustments also calibrate your own comp methodology going forward.
Rental-income check (for buy-and-hold conversions). If your exit strategy might shift from flip to rental, run a gross rent multiplier (GRM) or cap-rate check. A property with an ARV that implies a 4% cap rate in a 7% cap-rate market is overvalued relative to its income potential. That gap is a red flag worth investigating before you commit.
What are the 70% rule and other investor rules of thumb?
Rules of thumb exist to speed up screening, not replace full underwriting. Use them to filter deals quickly, then build a proper ARV before making an offer.
The 70% MAO formula:
MAO = (ARV × 0.70) − estimated repair costs
Example from the standard 70% rule: ARV $200,000 × 70% = $140,000 − $30,000 repairs = $110,000 maximum bid.
Market variants:
- 75% rule: Used in competitive markets where deal flow is thin. Higher purchase price, tighter margin, more risk.
- 80% rule: Occasionally used by experienced operators with low rehab costs and fast exit timelines. Not appropriate for most investors.
Stress tests to run before every offer:
- Reduce ARV by 5–12% to model a softening market or appraisal shortfall.
- Add 15–30% to rehab costs for overruns and timeline extensions.
- Extend your projected hold time by 30–60 days and recalculate carrying costs.
When lenders enforce ARV conservatism. Hard-money and bridge lenders typically lend against their own appraised ARV, not yours. If their appraiser comes in 8% below your estimate, your loan-to-value ratio shifts and you may need to bring more cash to close. Build that scenario into your financing plan before you’re under contract.
Pro Tip: Document three scenarios for every deal: best-case, base-case, and conservative. Write down the specific assumption that changes between them (ARV, repair cost, hold time). If the conservative case still pencils, you have a deal worth pursuing.
Common mistakes investors make when estimating ARV
Even experienced investors make these errors. Knowing them in advance is the fastest way to avoid a costly mistake.
Over-relying on a single high-price comp. One strong sale does not make a market. Check that comp’s DOM and price-reduction history before anchoring to it. Properties with 60+ days on market or multiple price reductions often indicate softer demand, and using them at face value inflates your ARV.
Underestimating soft costs. Permits, inspections, architectural drawings, and utility connections add up fast. Investors who budget only for materials and labor routinely find their actual costs running 15–25% higher than projected.
Using listing prices as comps. Active listings are not sold prices. Treating a $220,000 listing as a comp when the neighborhood’s actual close prices run $195,000 is a $25,000 error that flows directly into your MAO.
Ignoring seasonality and rate-driven demand shifts. A comp from last spring may not reflect today’s buyer pool if mortgage rates have moved significantly. Always note the rate environment at the time each comp closed and adjust your expectations accordingly.
Thin-data market warning. In markets with fewer than three recent comparable sales, a single distressed or outlier transaction can skew your entire ARV. Expand your search radius and time window, and lean on the replacement-cost method as a secondary check. Never present a thin-data ARV to a lender without disclosing the limitation and showing your cross-check methodology.
Which tools help you estimate ARV faster and more accurately?
The right tool depends on where you are in the deal cycle: quick screening, detailed underwriting, or lender-ready documentation.
MLS and broker platforms. The starting point for any serious comp search. MLS gives you closed prices, DOM, concession notes, and listing history that consumer portals omit. Access requires a licensed agent relationship or, in some states, a salesperson license.
Address-based ARV calculators. Tools like the LendingOne ARV calculator and similar platforms let you enter a property address and get a quick estimated ARV range for initial screening. Useful for filtering a pipeline of 20 properties down to 3–4 worth deeper analysis.
Consumer portals (Zillow, Redfin, Bungalow). Good for neighborhood orientation and rough value ranges. Zillow’s Zestimate and Redfin’s estimate are automated valuation models, not appraisals. Use them to sanity-check your comp-based ARV, not to replace it.
Rehab-cost estimators. Spreadsheet-based SOW templates work well for single projects. For investors running multiple deals simultaneously, photo-based AI estimators reduce the time required to produce a first-pass rehab budget from hours to minutes.
Appraisal platforms. For deals requiring lender-grade documentation, ordering a desk or drive-by appraisal through a licensed AMC (appraisal management company) produces a defensible third-party value opinion.
Inputs every calculator needs to produce a reliable output:
- Verified square footage (tax records or measured)
- Adjusted comp prices with close dates
- Detailed SOW with contractor allowances or AI-estimated ranges
- Holding cost assumptions (financing rate, insurance, taxes, utilities)
- Target exit price and timeline
Dealanalyzerai addresses the full workflow in one platform. Its AI evaluates comparable sales, analyzes uploaded property photos to produce rehab cost ranges, and outputs an automated MAO. For investors screening multiple properties weekly, that combination reduces the time between deal identification and a defensible offer. The ARV analysis tool also generates documentation formatted for lender and partner review, which removes a significant friction point in the financing process.
Pro Tip: Combine two independent cost sources — a human contractor bid and an AI photo estimate — before finalizing your contingency. When they agree, your budget is solid. When they diverge by more than 20%, dig into why before you proceed.
Worked example: from comps to ARV to MAO
Here is a concrete flip scenario using realistic numbers.
Subject property: 3-bed/2-bath, 1,400 sqft, needs full kitchen and bath renovation plus cosmetic updates.
Step 1: Comp table
| Comp | Sale Price | Sqft | PPSF | Adjustment Notes |
|---|---|---|---|---|
| A | around $210k | — | about $150 | Similar condition; adjustment for extra half-bath |
| B | near $200k | — | around $140 | Slightly larger; size adjustment |
| C | mid-$170,000s | — | — | Good match; minor lot premium |
| D | mid-$170,000s | — | about $150 | Updated kitchen; condition adjustment |
Adjusted prices: Range in the low $190Ks to low $210Ks
Average adjusted price: Approximately $200k
Median PPSF: Around $150 multiplied by subject square footage
Step 2: ARV range
- Conservative ARV: $193,000 (weakest adjusted comp)
- Likely ARV: $204,000 (adjusted average)
- High ARV: $213,000 (strongest comp)
Use $204,000 as your working ARV.
Step 3: Rehab estimate
Step 4: MAO calculation
| Scenario | ARV | Formula | MAO |
|---|---|---|---|
| Conservative | near $190k | × 70% minus rehab estimate | estimated MAO in the low $70ks |
| Base case | about $200k | × 70% minus rehab estimate | estimated MAO in the low $80ks |
| Best case | near $210k | × 70% minus rehab estimate | estimated MAO approaching mid $80ks |
Offer at or below your calculated MAO. If the seller’s asking price exceeds this, adjust your rehab budget or accept a smaller margin.
Key Takeaways
Accurate ARV estimation requires recent comps, documented adjustments, a realistic rehab budget, and at least one independent cross-check before you submit a number to a lender or partner.
| Point | Details |
|---|---|
| Use recent, closed comps | Pull 4–6 sales within 90 days and 0.5 miles; verify prices against MLS or public records. |
| Document every adjustment | Record each comp’s DOM, price reductions, and adjustment rationale to defend your ARV during financing. |
| Include contingency in rehab costs | Add 10–20% to your line-item SOW for unseen issues, permit delays, and material overruns. |
| Cross-check with PPSF and cost approach | Validate your comp-derived ARV against neighborhood PPSF and, for unique properties, replacement cost. |
| Dealanalyzerai accelerates the process | AI-assisted comps analysis, photo-based rehab estimates, and automated MAO output reduce screening time and improve documentation. |
When to recalculate: If your project runs more than 90 days behind schedule or the local market shifts materially (rate changes, inventory spike, comparable price drops), re-run your comps before proceeding.
An investor-analyst’s take on tightening ARV estimates
The investors who consistently produce accurate ARVs share one habit: they treat the estimate as a living document, not a one-time calculation. Re-running comps weekly on active projects catches market drift before it becomes a financing problem. Requiring two contractor bids on every project, not just the large ones, surfaces scope gaps that a single quote routinely misses.
Conservative project timelines matter more than most investors admit. A deal that pencils at 90 days often looks very different at 150 days when carrying costs have compounded. Building that scenario into your stress test before you make an offer is the difference between a deal that works and one that merely looked like it would.
The documentation habit is equally important. Lenders and equity partners respond well to an ARV package that shows the comp selection logic, the adjustment rationale, the contractor bids, and the stress-test scenarios side by side. That level of transparency shortens approval timelines and builds the kind of credibility that gets you better terms on the next deal.
Dealanalyzerai cuts the time from deal to defensible offer
Pulling comps, adjusting for differences, building a rehab SOW, and stress-testing your MAO is a multi-hour process when done manually. Dealanalyzerai compresses that workflow significantly. The platform’s AI evaluates comparable sales and normalizes adjustments, analyzes uploaded property photos to produce rehab cost ranges, and generates an automated MAO output, all in one place.
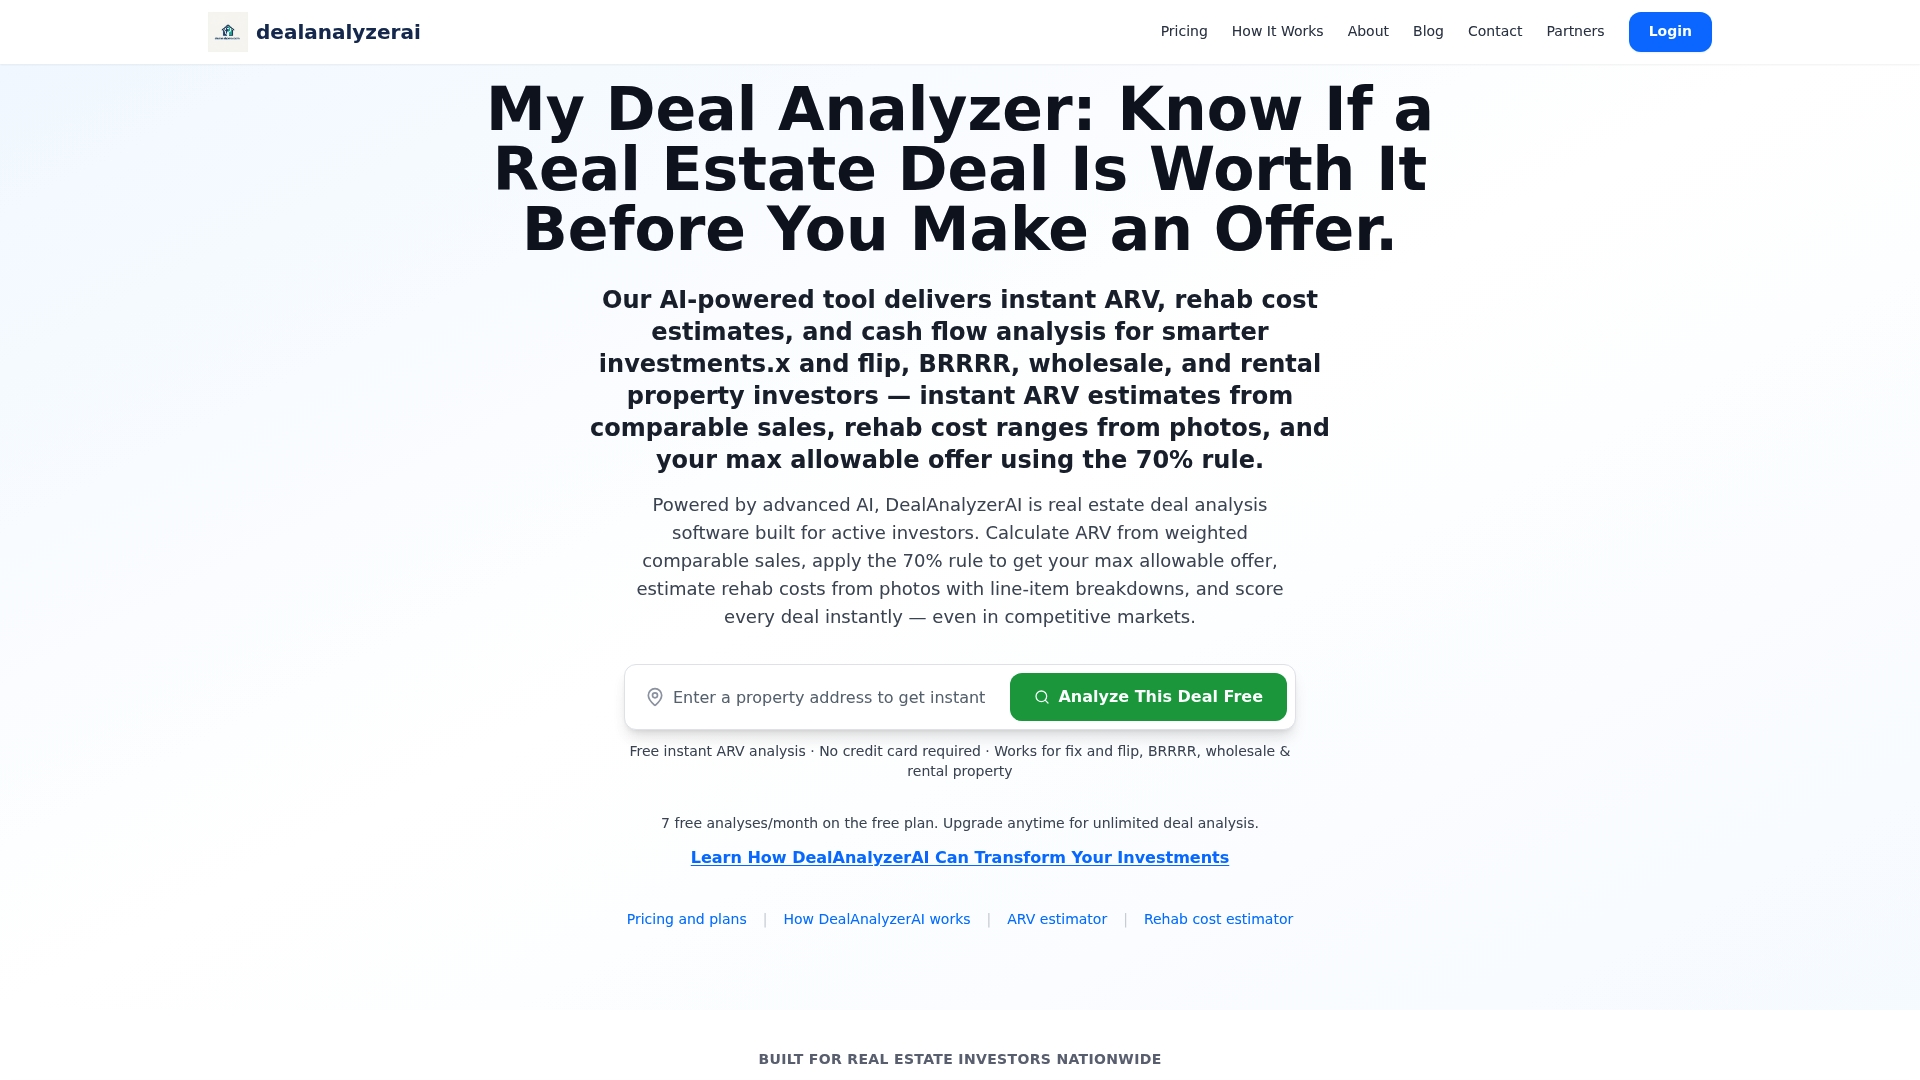
For investors running multiple deals a week, that speed advantage compounds. You get ARV ranges, risk flags, and lender-ready documentation without building a new spreadsheet for every property. The free ARV calculator handles quick address-based estimates for pipeline screening, while the full deal analyzer produces the documentation package your lender actually wants to see.
Run your next deal through Dealanalyzerai and see how quickly a defensible ARV and MAO come together.
Useful sources and further reading
- How to Calculate ARV in Real Estate — Groundfloor’s lender-perspective guide on CMA methodology, 90-day comp windows, and replacement-cost cross-checks.
- How To Calculate After-Repair Value (ARV) — BiggerPockets walkthrough of the comps-based method, rehab contingency guidance, and SOW best practices.
- After-Repair Value Formula — FitSmallBusiness breakdown of the 70% rule, MAO formula, and market variants.
- What Is ARV? — Motley Fool overview of ARV fundamentals and how to apply the formula for offer pricing.
- ARV Loan Calculator — LendingOne’s address-based ARV calculator for quick deal screening.
- ARV Calculation Methods Compared — Dealanalyzerai’s in-depth comparison of CMA, PPSF, and replacement-cost methods.
- Free ARV Calculator (AI-Powered) — Dealanalyzerai’s ARV calculator for fast, address-based estimates.
- Free Rehab Cost Estimator — Photo-based rehab cost tool for producing contractor-style breakdowns before a site visit.
FAQ
How do you calculate ARV using the 70% rule?
The formula is MAO = (ARV × 0.70) − estimated repair costs. For example, an ARV of $200,000 with $30,000 in repairs produces a maximum bid of $110,000.
What does 75% ARV mean for a flip?
Using 75% instead of 70% means you’re willing to pay more relative to the ARV, which tightens your profit margin. It’s used in competitive markets where deals are scarce, but it increases risk if rehab costs run over or the market softens.
What is a good ARV percentage for house flipping?
Most investors target a purchase price at or below 70% of ARV minus repair costs. Going above 75% of ARV significantly reduces the margin available to absorb cost overruns or a slower-than-expected sale.
What is the 75% ARV rule: flipping formula explained?
The 75% variant works similarly to the 70% rule: MAO = (ARV × 75%) − estimated repair costs. It allows a higher offer price but leaves less buffer for overruns, so it suits experienced operators with tight rehab control and fast exit timelines.
How does Dealanalyzerai help with estimating ARV?
Dealanalyzerai uses AI to evaluate comparable sales, analyze property photos for rehab cost ranges, and produce an automated MAO, giving investors a defensible ARV package without building a manual spreadsheet for every deal.
Recommended
Analyze Your Next Deal with AI
Get an instant ARV estimate, rehab cost analysis, and deal score — free for 7 days.
Get Free Deal Breakdown