Investors: 3 Inputs That Decide Airbnb Cash Flow; Lender Haircuts Matter
Investor how-to with step-by-step pro forma using real ADR and occupancy comps, lender haircuts, realistic expense ranges, a worked example, and...
By DealAnalyzerAI Editorial Team
Real estate investing education and deal-analysis research from DealAnalyzerAI.

Investors: 3 Inputs That Decide Airbnb Cash Flow; Lender Haircuts Matter
Your Airbnb will cash flow or it won’t, and the answer almost always comes down to three inputs: average daily rate, occupancy, and how the deal is financed. Before you fall in love with a listing, run a property-level pro forma using real ADR and occupancy comps, not platform estimates or national averages. Pull three comparable listings’ realized performance data today and you’ll know within twenty minutes whether the deal is worth pursuing further.
TL;DR:
- Pull realized performance data from at least three comparable listings to ensure accurate ADR and occupancy assumptions, as averages can be misleading.
- Expect operating expenses to typically range from 35% to 55% of gross revenue; expenses below 30% likely omit key line items.
- Use conservative assumptions, including a 15% to 20% revenue haircut, to test if a deal remains cash flow positive under lender stress conditions.
- Understand that occupancy rates below 40% to 55% generally lead to negative cash flow, making break-even occupancy a critical target.
- Incorporate start-up costs like furnishing, photography, and supplies into cash-on-cash calculations to avoid overly optimistic projections.
Table of Contents
- What Is Airbnb Cash Flow Analysis and Which Metrics Matter?
- What Should Go Into an Airbnb Cash-Flow Model?
- How Do You Calculate Airbnb Cash Flow Step by Step?
- What Does a Real Airbnb Pro Forma Look Like?
- What Mistakes Turn a Good Pro Forma Into a Loss?
- How Do You Pick and Use an Airbnb Income Calculator?
- How DealAnalyzerAI Tightens Uncertain Airbnb Inputs
- How Do Airbnb Taxes Affect Your Cash Flow?
- How Do Local Regulations Affect Airbnb Revenue and Costs?
- An Editorial Take on Underwriting Priorities
- Run Your Numbers Before You Make an Offer
- Sources
- FAQ
What Is Airbnb Cash Flow Analysis and Which Metrics Matter?
Airbnb cash flow analysis is the process of forecasting a short-term rental’s monthly and annual income after every expense, including the mortgage, so you know what actually lands in your account. Investors sometimes confuse this with net operating income, but the two aren’t the same thing.
Net operating income (NOI) is gross revenue minus operating expenses, before debt service. Net cash flow is NOI minus your annual mortgage payment (principal and interest). If NOI is $28,000 and your annual debt service is $19,000, your net cash flow is $9,000. That distinction trips up a lot of first-time analysts who quote NOI as if it were spendable cash.
A few other metrics decide whether a deal clears your bar:
- Cap rate = NOI ÷ purchase price. It tells you the property’s return assuming no financing, which makes it useful for comparing deals on an apples-to-apples basis.
- Cash-on-cash return (CoC) = annual net cash flow ÷ total cash invested. Unlike cap rate, cash-on-cash return accounts for leverage, which is why it matters more to anyone financing the purchase rather than paying all cash.
- DSCR (debt service coverage ratio) = NOI ÷ annual debt service. Lenders use this to decide if the property’s income can cover the loan payment, and it drives whether you get approved at all.
- Break-even occupancy is the occupancy rate at which revenue exactly covers expenses and debt service. Below that number, you’re losing money every month.
Cap rate tells you how the asset performs. Cash-on-cash tells you how your money performs once a lender is involved.
What Should Go Into an Airbnb Cash-Flow Model?
A model is only as good as its inputs, and Airbnb rental analysis fails most often because someone leaves out a line item, not because the formula is wrong. Build your checklist in two buckets: revenue and expenses, then add startup costs separately since they factor into cash-on-cash but not monthly cash flow.
Revenue inputs:
- Average daily rate (ADR), pulled from realized comps rather than platform “estimated earnings” tools
- Occupancy rate, ideally trailing 12 months to capture seasonality
- Cleaning fees, noting whether the guest pays them directly or the host absorbs the cost
- Additional income: pet fees, early check-in, parking, or damage waiver upsells
Operating expenses and realistic ranges:
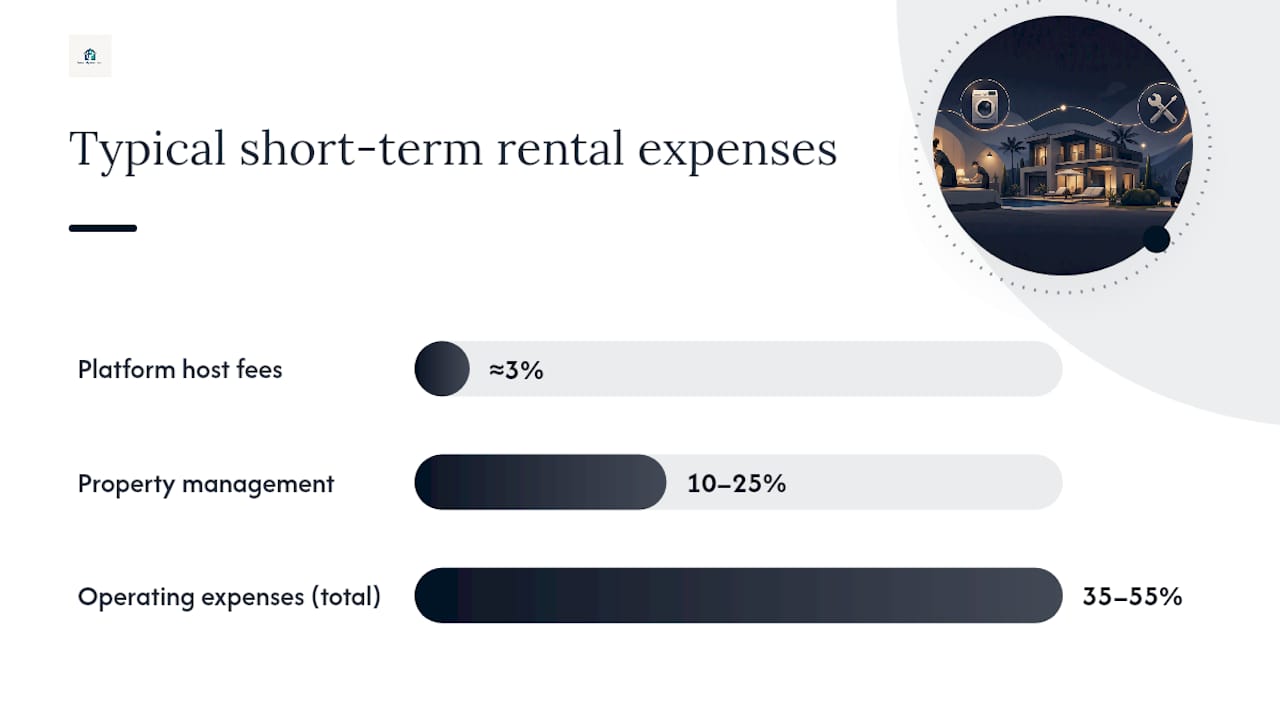
- Platform host fees, typically around 3% of the booking subtotal
- Cleaning per turnover, usually $100 to $250 depending on unit size and market
- Property management, running 10% to 25% of gross revenue if you outsource it
- Utilities, often 30% to 50% higher than a long-term rental because you’re covering everything guests use
- Short-term rental insurance, which frequently costs 20% to 40% more than a standard landlord policy
- Maintenance reserves, roughly 1% to 2% of the property’s value annually
- Property taxes and HOA dues, which vary widely by jurisdiction
Statistic Callout: Operating expenses for short-term rentals typically run 35% to 55% of gross revenue, with self-managed properties landing near the low end and professionally managed units running higher. If your model shows expenses under 30%, you’ve probably missed a line item.
Startup costs to fold into cash-on-cash math: Furnishing a two-bedroom unit for short-term guests typically runs $15,000 to $40,000, covering furniture, linens, small appliances, and decor. Add professional photography and an initial supplies stock (toiletries, coffee, cleaning products), and roll the total into “cash invested” alongside your down payment and closing costs. Skip this step and your cash-on-cash return will look better than reality.
How Do You Calculate Airbnb Cash Flow Step by Step?
The math itself isn’t complicated once you have real inputs. Work through it in this order:
- Calculate gross revenue. Multiply ADR by 365 nights by your occupancy rate, or simply sum nightly rate times booked nights across the year. A property renting at $180 ADR with 60% occupancy generates $39,420 in room revenue annually.
- Add ancillary income. Layer in cleaning fee reimbursements and any add-on fees guests pay.
- Subtract operating expenses. This gives you NOI: gross revenue minus platform fees, cleaning, management, utilities, insurance, maintenance, taxes, and HOA.
- Subtract annual debt service. NOI minus your yearly mortgage principal and interest payment equals net cash flow.
- Divide by cash invested for CoC. Net cash flow divided by total cash invested (down payment, closing costs, furnishing, reserves) gives your cash-on-cash return.
- Divide NOI by purchase price for cap rate. This strips out financing entirely, useful for comparing across deals with different loan structures.
Lenders rarely take your projected revenue at face value. Most DSCR lenders apply a revenue haircut of 15% to 20% before running their own numbers, and they generally want to see a DSCR between 1.0 and 1.25 before approving the loan. Run your own numbers through that same haircut before you fall for a deal a lender will reject.
To convert per-night figures into monthly ones, divide your annual gross revenue by 12, but expect real variance. Peak months can generate three to five times the revenue of slow months, so a straight-line average understates your cash flow risk.
What Does a Real Airbnb Pro Forma Look Like?
Numbers make this concrete. Take a two-bedroom property purchased for $340,000, with a $68,000 down payment (20%) and a mortgage at $1,750 monthly principal and interest.
Baseline scenario: ADR of $195, 58% occupancy, 12 turnovers per month at $150 cleaning each, 15% property management fee, $4,200 in annual property taxes.
- Annual gross revenue: $195 × 365 × 0.58 = $41,278
- Cleaning income offset (guest-paid): +$21,600, cleaning expense: −$21,600 (net neutral, but include both lines)
- Operating expenses (management, platform fees, utilities, insurance, maintenance, taxes): roughly $18,900
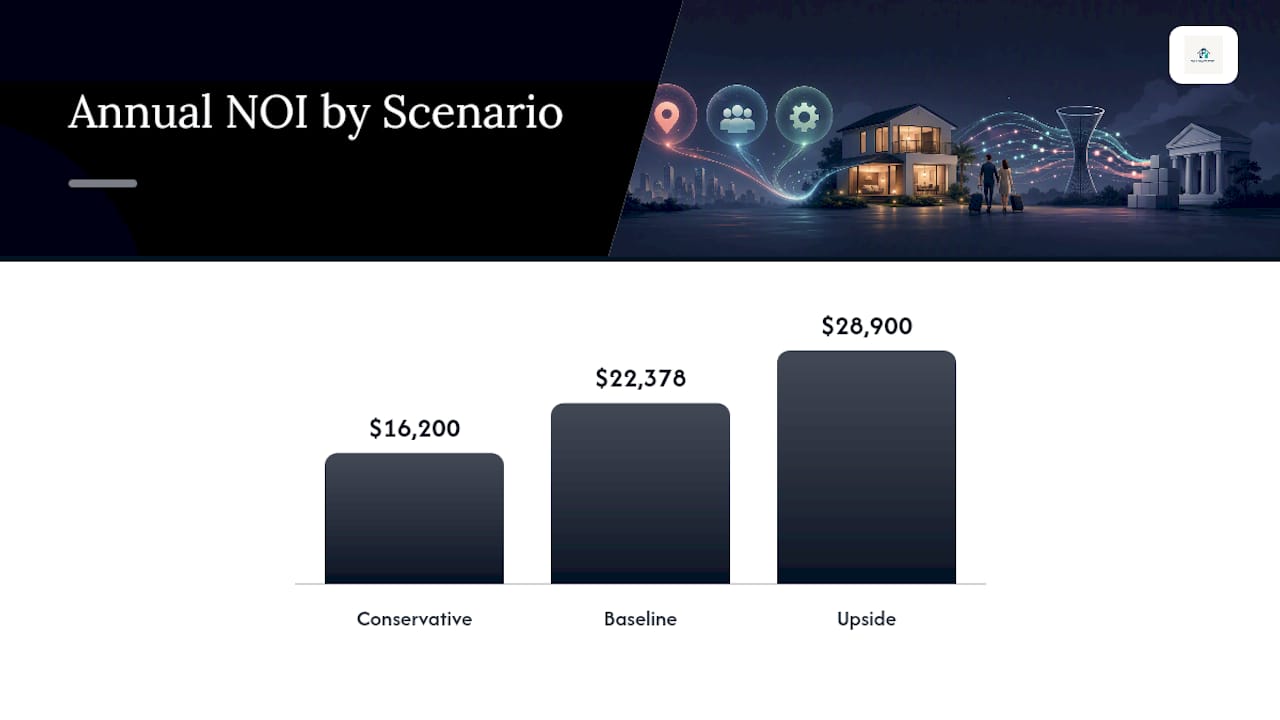
- NOI: $41,278 − $18,900 = $22,378
- Annual debt service: $1,750 × 12 = $21,000
- Net cash flow: $22,378 − $21,000 = $1,378 annually, or about $115 a month
- Cash invested: $68,000 down payment + $22,000 furnishing/closing = $90,000
- Cash-on-cash return: $1,378 ÷ $90,000 = 1.5%
That baseline is thin. Two adjustments show how sensitive the deal really is.
| Scenario | ADR | Occupancy | Annual NOI | Net Cash Flow | Cash-on-Cash |
|---|---|---|---|---|---|
| Conservative (20% revenue haircut) | $195 | 46% | $16,200 | −$4,800 | Negative |
| Baseline | $195 | 58% | $22,378 | $1,378 | 1.5% |
| Upside (higher ADR, lower mgmt fee) | $215 | 62% | $28,900 | $7,900 | 8.8% |
The conservative scenario applies the 15% to 20% lender haircut to revenue and bumps cleaning and vacancy costs, which pushes the deal into negative cash flow. Break-even occupancy on this property lands close to 52%, well inside the 40% to 55% range typical for this expense structure. A six-point occupancy swing is the difference between profit and loss.
Pro Tip: Before you make an offer, verify occupancy and ADR against at least three comps with 12 months of realized booking history. Nothing else in your model moves the outcome as much as these two numbers.
What Mistakes Turn a Good Pro Forma Into a Loss?
The gap between a spreadsheet that looks great and a property that actually pays you almost always comes from a handful of predictable errors.
Hidden costs that get left out:
- Cleaning turnover costs that run higher than budgeted, especially for larger units or same-day turnovers
- Ongoing supply replenishment (toiletries, coffee, paper goods) that adds up faster than hosts expect
- Utility bills that spike 30% to 50% above long-term rental averages
- Short-term rental insurance gaps if the policy doesn’t actually cover STR use
- Short-term rental permit or registration fees, which some cities charge annually
- HOA rules that restrict or ban short-term rentals outright, discovered only after closing
- Seasonality gaps between bookings that create real vacancy even in “high occupancy” markets
Modeling errors that inflate projected income: Relying on citywide averages instead of property-level comps is the single biggest mistake. Market-level dispersion runs wide: the 90th-percentile listing in a market can earn roughly three times what the median listing earns. Averages hide that spread completely. Other common errors include ignoring the ramp-up period (new listings rarely hit full occupancy in month one), excluding startup costs from cash-on-cash math, and skipping lender haircuts entirely.
The fix is straightforward: pull realized comps, add a 10% to 20% operating buffer on top of your expense estimate, and always calculate break-even occupancy before you calculate profit.
How Do You Pick and Use an Airbnb Income Calculator?
Not every Airbnb income calculator is built the same way, and the quality of your output depends entirely on the quality of what you feed in.
Where to source your inputs:
- Prefer booking-history ADR and occupancy from realized comps over platform-generated “potential earnings” estimates, which tend to run optimistic
- Pull trailing 12 months of data where available, since monthly revenue can swing three to five times between peak and off-peak periods
- Run every deal through three scenarios (conservative, baseline, upside) instead of a single point estimate
What to check before trusting a calculator’s output:
- Does it separate cleaning income from cleaning expense, or net them together and hide the real turnover cost?
- Does it let you set a custom management percentage instead of defaulting to a national average?
- Does it apply a lender haircut option, or does it assume 100% of projected revenue counts toward DSCR?
- Does it include furnishing and startup costs in the cash-on-cash calculation?
A rental property cash flow calculator that lets you toggle these assumptions will give you a far more honest picture than one that spits out a single “expected profit” number.
How DealAnalyzerAI Tightens Uncertain Airbnb Inputs
The two biggest sources of error in any Airbnb profit analysis aren’t ADR or occupancy. They’re after-repair value and rehab cost, because both require judgment calls that vary wildly between investors. DealAnalyzerAI attacks that uncertainty directly.
The workflow: upload listing photos and the property address, and the AI generates an ARV range along with a photo-driven rehab cost estimate. From there, you populate your furnishing and startup costs, calculate a maximum allowable offer, and run the same cash-flow and cash-on-cash math covered above inside the platform’s investment property calculator.
What this changes in practice:
- Comps get pulled and evaluated automatically instead of manually cross-referencing five listing sites
- Rehab estimates come from actual photos of the unit rather than a flat per-square-foot guess
- Risk flags surface missing line items, like a permit requirement or an HOA restriction, before you make an offer
How Do Airbnb Taxes Affect Your Cash Flow?
Airbnb income is taxable, but the deductions available to short-term rental owners are what actually determine your after-tax cash flow. Depreciation is the largest lever: the IRS lets you depreciate the structure’s value over 27.5 years for residential property, and that non-cash deduction can shelter a meaningful chunk of your taxable income even while cash keeps flowing into your account.
Operating expenses you’re already tracking for your pro forma, cleaning, management fees, utilities, insurance, maintenance, and platform fees, are generally deductible in the year you incur them. So is mortgage interest, though not the principal portion of your payment.
One distinction matters more for Airbnb hosts than for traditional landlords: the “material participation” test. If you average more than seven days per guest stay and provide substantial services (cleaning, meals, concierge-type support), the IRS may treat your rental as a trade or business rather than passive rental activity. That changes which tax forms you file and how losses offset other income.
Self-employment tax can also apply if your short-term rental rises to the level of an active business rather than a passive investment. This is highly fact-specific, and the line moves depending on your service level and rental duration. Talk to a CPA who has handled short-term rental clients before you assume your Airbnb gets the same tax treatment as a long-term lease. The wrong assumption here can turn a cash-flow-positive property into an unpleasant April surprise.
How Do Local Regulations Affect Airbnb Revenue and Costs?
Short-term rental regulations vary block by block in some cities, and they hit both sides of your pro forma: revenue and expenses.
Revenue-side impacts: Some municipalities cap the number of nights a property can be rented annually, which puts a hard ceiling on occupancy regardless of demand. Others require the owner to be an on-site resident, which eliminates the investment model entirely for non-owner-occupied units. Zoning restrictions can also limit short-term rentals to specific districts, which shrinks your buyable market before you even start comping properties.
Expense-side impacts: Registration and licensing fees are increasingly common and often renew annually. Some jurisdictions require a business license, a fire inspection, or proof of liability insurance above standard homeowner policy limits, each adding a recurring line item to your expense checklist. HOA rules deserve separate scrutiny since many communities ban short-term rentals outright in their governing documents, a detail that rarely shows up in a listing description.
Before you run any Airbnb investment analysis, check the specific city and county ordinance, not just a general web search, since rules change frequently and enforcement varies. A property that cash-flows beautifully on paper can become unrentable the moment a permit application gets denied. Build a line item for compliance costs into every model, even if it’s currently zero, so you notice immediately when a regulation changes and adds one.
An Editorial Take on Underwriting Priorities
Most Airbnb deal analysis fails for a boring reason: people trust the wrong number first. Verify ADR and occupancy from realized comps, then run the deal at the lender’s conservative assumptions before you ever look at the upside case. If it survives that stress test, you have a real deal. If it only works in the best-case column, you have a hope, not a plan.
Buy for cash flow when the break-even occupancy sits comfortably below your conservative estimate. Buy for appreciation only when you can absorb a negative-cash-flow year without stress. Confusing the two is how investors get stuck holding properties that drain reserves for years. For a faster version of this same discipline, our guide on analyzing a rental property in 30 minutes walks through the shortcut version of this exact process.
— Sam
Run Your Numbers Before You Make an Offer
Every formula in this guide works. The problem most investors run into isn’t the math, it’s the two inputs that eat the most time: figuring out a realistic after-repair value and pricing rehab costs without guessing. DealAnalyzerAI solves both by reading your listing photos and address, then generating an ARV range and a photo-driven rehab estimate in minutes instead of hours spent cross-referencing comps by hand.
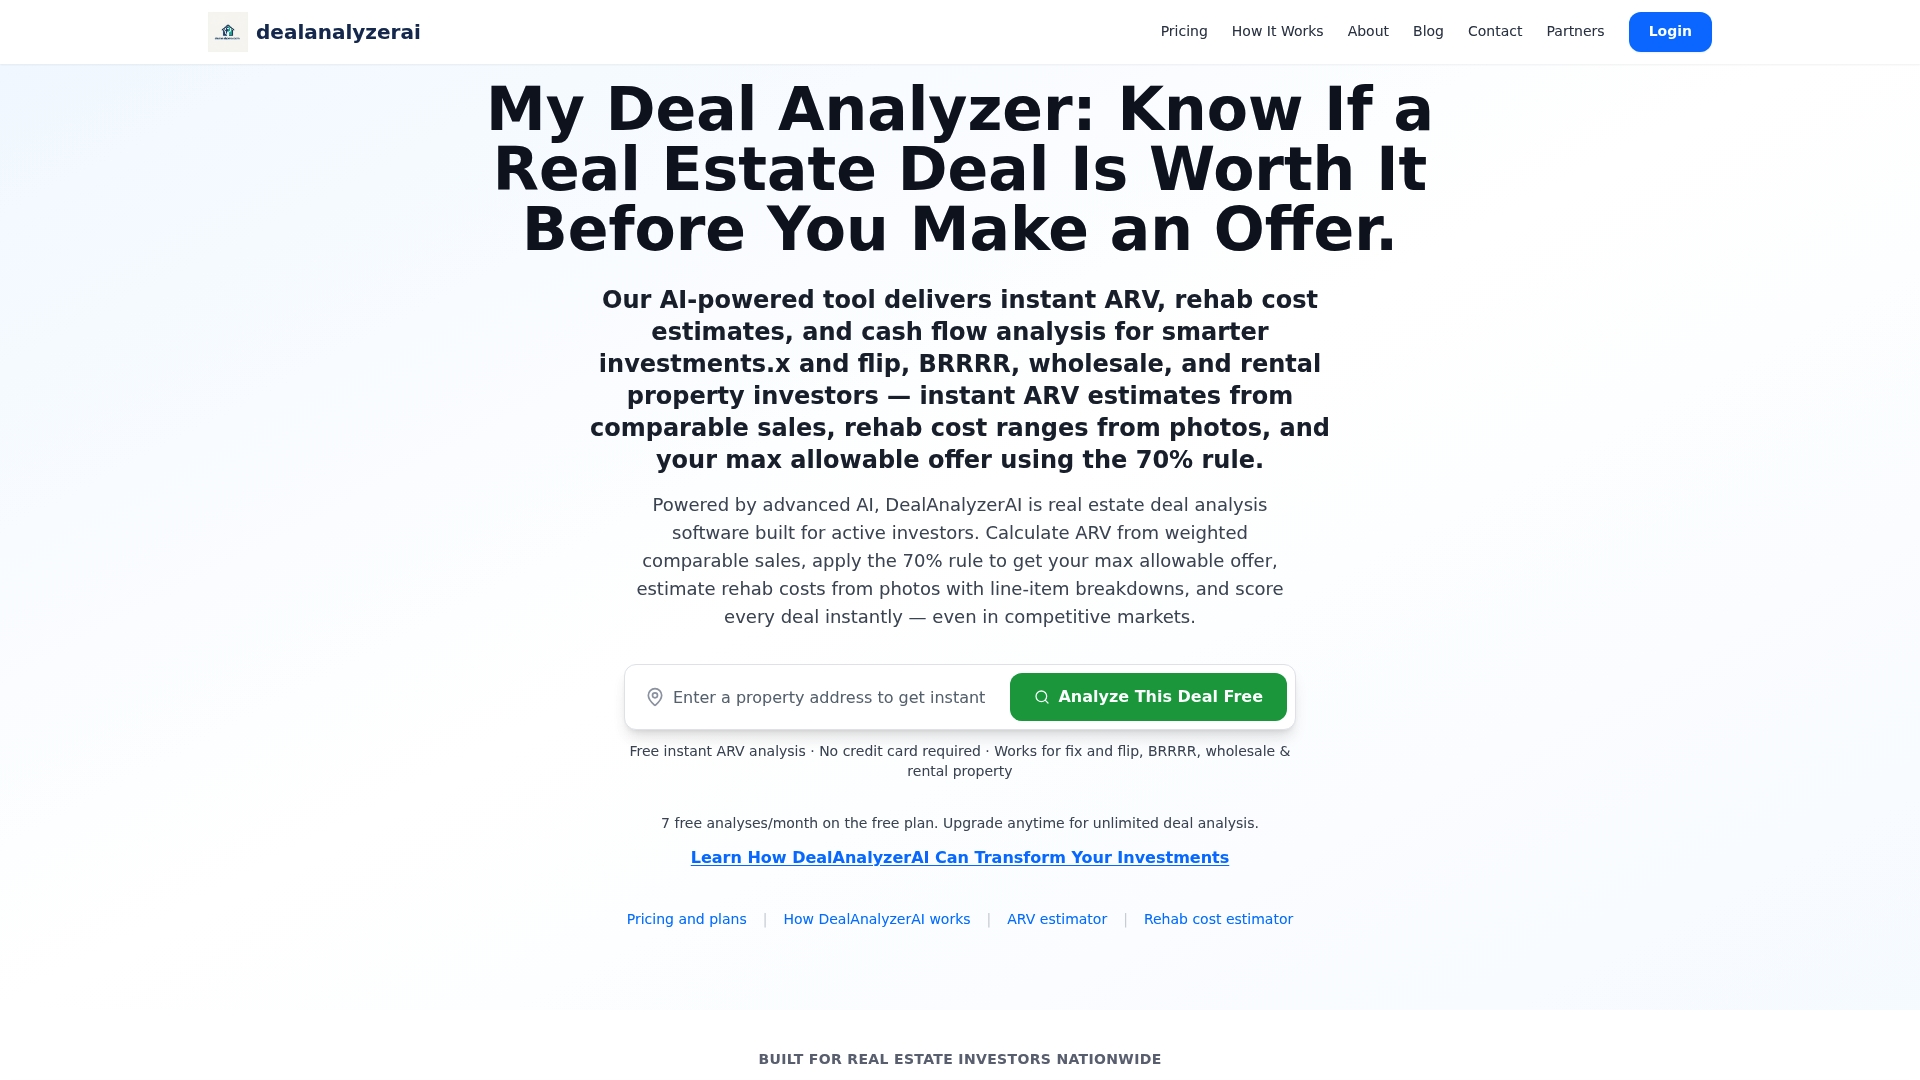
From there, you can populate your maximum allowable offer, run the same cash-on-cash and NOI calculations covered in this article using the platform’s built-in cap rate and cash-on-cash calculator, and export a shareable deal report before you submit an offer. The free tier gets you started with core analysis at no cost, and the Premium plan at $97 per month unlocks the full suite, including off-market search and renovation estimation, for investors screening multiple properties every week. Start with a free deal analysis and see how much faster your next underwrite goes.
Sources
- Cap Rate vs Cash on Cash Return (Wall Street Prep)
- How to Calculate Airbnb Cash Flow Before You Buy (StaySTRA)
- Airbnb Calculator — Short-Term Rental Profit Estimator (CalcFi)
- How to Analyze an Airbnb Market (AirROI)
FAQ
What Is the 2% Rule for Rentals?
The 2% rule says monthly rent should equal at least 2% of the purchase price for a property to likely cash flow well. It’s a rough screening tool for long-term rentals and rarely applies cleanly to Airbnb, where revenue depends on ADR and occupancy rather than a fixed lease amount.
What Is Break-Even Occupancy and Why Does It Matter?
Break-even occupancy is the occupancy rate at which your revenue exactly covers operating expenses and debt service, with nothing left over. It typically falls in the 40% to 55% range depending on your expense structure, and any occupancy above that line is where actual profit starts.
Are Airbnbs Still Profitable in 2026?
Airbnb rentals can still be profitable, but profitability now depends heavily on market selection rather than the category as a whole. National weighted average occupancy sits near 56%, and only a minority of markets reliably generate revenue strong enough to clear expenses and debt service after a proper stress test.
How Do I Estimate Rehab Costs for a Short-Term Rental Conversion?
Rehab costs for converting a property into a short-term rental vary by unit size, condition, and furnishing needs, with furnishing alone often running $15,000 to $40,000 for a two-bedroom unit. DealAnalyzerAI’s rehab cost estimator generates a photo-driven estimate that accounts for the property’s actual condition instead of a flat per-square-foot guess.
What Financing Options Work Best for Airbnb Cash Flow?
DSCR loans are common for Airbnb purchases because they qualify the property on its income rather than the buyer’s personal income, but lenders typically apply a 15% to 20% revenue haircut and require a DSCR between 1.0 and 1.25. A larger down payment lowers your debt service and makes it easier to clear that threshold, directly improving monthly cash flow.
Recommended
Analyze Your Next Deal with AI
Get an instant ARV estimate, rehab cost analysis, and deal score — free for 7 days.
Get Free Deal Breakdown