Standardize Investment Property Scoring for Active Investors
Learn how to standardize investment property scoring with AI. Cut analysis time and improve decision-making by ranking properties effectively.
By DealAnalyzerAI Editorial Team
Real estate investing education and deal-analysis research from DealAnalyzerAI.

Standardize Investment Property Scoring for Active Investors
TL;DR:
- A repeatable AI property score combines financial estimates, risk flags, and market signals into a ranked output. Investors should calibrate the model on historical deals and validate it before applying it to live deal flow. The platform automates data extraction, scoring, and CRM integration, streamlining real estate analysis and decision-making.
A repeatable AI property score combines ARV ranges, photo-based rehab estimates, MAO calculations, cashflow/cap-rate projections, and hard risk flags into a single ranked output you can act on immediately. Before you run a single live deal through it, calibrate the model on 20–30 historical deals where you already know whether you pursued or passed.
TL;DR:
- A well-calibrated score ranks deals by expected return and risk, so your highest-priority properties surface automatically.
- AI can reduce initial screening time significantly, cutting per-deal analysis from 40–80 hours to 10–20 hours, resulting in substantial labor cost savings.
- Run your first backtest on 20–30 labeled past deals before going live; if the model ranks your “pass” deals above your “pursue” deals, adjust weights before production.
Table of Contents
- What components does an AI investment property score need?
- How do you normalize inputs and build a weighted scoring rubric?
- What data inputs and pipeline steps does batch scoring require?
- How do you validate and backtest a score investors can trust?
- Human-in-the-loop governance: where does human judgment stay?
- Copyable scorecard template and a worked example
- How do you turn scores into offers and pipeline actions?
- Dealanalyzerai: the ready solution for this scoring system
- Key Takeaways
- Why standardized scoring changes how you work
- Useful sources and product links
- FAQ
What components does an AI investment property score need?
Every property score must capture six inputs. Miss one and the ranking breaks down.
ARV range. The AI pulls comparable sales within a defined radius, filters by bed/bath count and square footage, and outputs a low/mid/high ARV range rather than a single point estimate. A range forces you to underwrite to the conservative number, not the optimistic one.
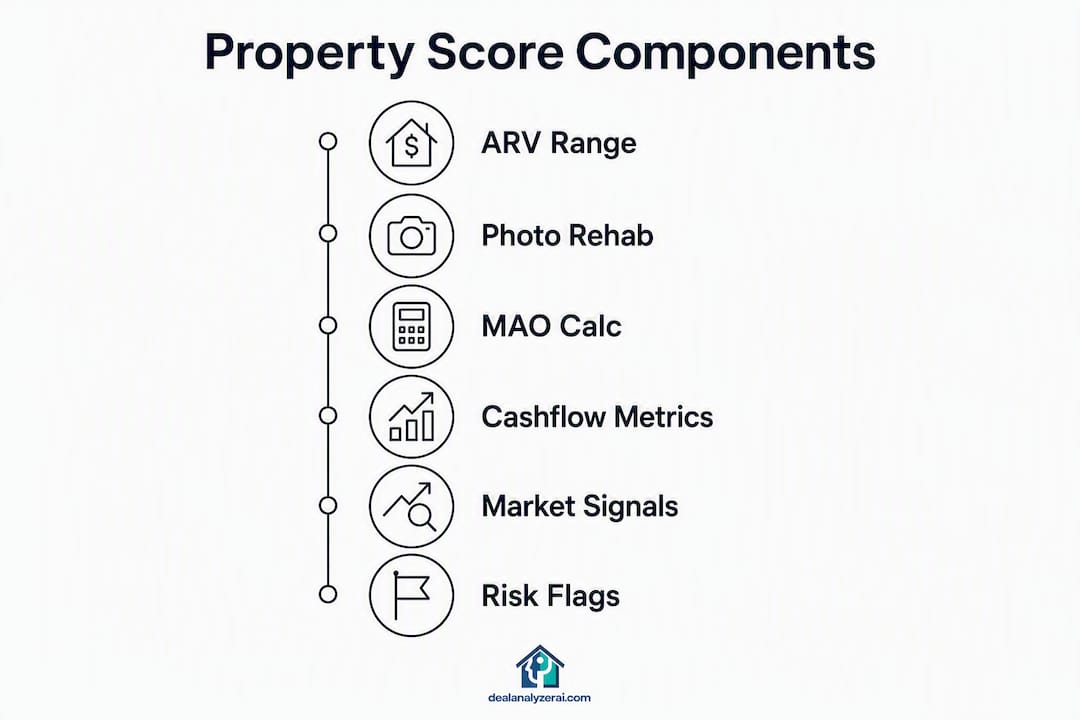
Photo-based rehab estimate. Upload a minimum photo set: interior living room, kitchen, each bathroom, exterior front and back, and roof. The AI maps visible defects to line-item cost ranges. Validate this module against at least 20 contractor-verified estimates before trusting it at scale.
MAO calculation. The standard formula is: MAO = (ARV × 70%) − rehab costs for flips. Adjust the multiplier to 65% for wholesale assignments or 75–80% for buy-and-hold depending on your exit strategy. The AI should apply the correct multiplier automatically based on the deal type you select.

Cashflow, cap rate, and ROI. For rentals, the score needs gross rent, vacancy rate, operating expenses, and debt service. Cap rate = NOI ÷ purchase price. These outputs let you compare a flip opportunity directly against a BRRRR candidate on the same scale.
Market momentum signals. Job growth, population trends, and new supply pipeline all affect whether today’s ARV holds in 12 months. Graph-based scoring models that link property financials to demographic and supply dynamics identify top-quartile deals with 70–75% precision, compared to 45–50% for traditional screening.
Hard risk flags. Title clouds, environmental liens, deferred maintenance beyond the rehab estimate, and lease roll concentration are binary stops, not scaled signals. Any one of them should trigger a human review gate before the deal advances.
Pro Tip: Require a T12 and rent roll for every multifamily submission. Without line-item income and expense history, the AI is estimating cashflow from assumptions, not actuals.
How do you normalize inputs and build a weighted scoring rubric?
Raw inputs arrive in different units: dollars, percentages, square footage, binary flags. Normalization converts them to a common 0–100 scale so you can add weighted scores meaningfully.
Normalization methods:
- Min-max scaling works when you know the realistic floor and ceiling for a metric (e.g., cap rates in your market range from 4% to 12%).
- Z-score normalization suits metrics with wide variance and no obvious ceiling, like ARV spread across markets.
- Percentile rank is the simplest option for small datasets: rank each property’s metric against the current batch and assign a 0–100 percentile.
For most active investors, min-max scaling on financial metrics and percentile rank on market signals is the practical starting point.
Starter weighting split and strategy variants
| Category | Starter Weight | Value-Add | Buy-and-Hold | Wholesale |
|---|---|---|---|---|
| Financial (ARV, cashflow, ROI) | 30% | 70–75% | 40% | — |
| Market momentum | — | 20% | 30% | 15% |
| Risk flags | — | — | 20% | 70–75% |
| Strategic fit (MAO delta, exit) | 20% | 20% | 10% | — |
Hard risk flags (title, environmental) operate as binary stops: a triggered flag zeros the final score regardless of weighted total. Scaled signals like deferred maintenance feed into the risk category as a graded input.
What data inputs and pipeline steps does batch scoring require?
Batch scoring at scale needs a clean data architecture. Here is the end-to-end flow:
| Pipeline Stage | Input | Output | Key Check |
|---|---|---|---|
| Ingest | CSV/OM exports, photo sets, rent rolls, T12s | Raw deal records | File format validation, duplicate detection |
| Extract | PDFs, scanned docs, photos | Structured fields | OCR accuracy; flag nonstandard documents for human review |
| Normalize | Extracted fields | 0–100 scaled scores | Range checks; outlier flagging |
| Enrich | Tax assessor feeds, comps, market indicators | Enriched deal record | Data freshness; source timestamp |
| Score | Enriched record + weight rubric | Ranked deal list | Model version logged |
| Export | Scored list | CRM/spreadsheet | Alert on scores above threshold |
AI extraction accuracy on structured financial data runs 90–97% on clean documents, but drops on scanned or older PDFs. Flag those for manual verification before scoring. Autonomous AI agents can run document extraction, financial modeling, and market synthesis to produce pre-underwriting summaries in minutes when inputs are structured and decision criteria are explicit. Learn more about automating your property analysis pipeline to reduce manual steps further.
How do you validate and backtest a score investors can trust?
Validation is what separates a scoring model from a scoring guess.
- Assemble your labeled dataset. Collect 20–30 historical deals with known outcomes: pursued or passed, and realized ROI where available.
- Run the model blind. Score each deal without letting the model see your final decision. Record the ranked output.
- Measure rank ordering. Did the model rank your best pursued deals in the top tier? Calculate hit-rate: the percentage of top-scored deals that you would have pursued.
- Measure ARV accuracy. Compare the model’s ARV midpoint to actual sale or appraisal values. Mean Absolute Error (MAE) below 8–10% is a reasonable acceptance threshold for most markets.
- Adjust weights iteratively. If passed deals rank above pursued deals, reduce the weight of the category where those deals scored highest and rerun.
- Set a go/no-go threshold. Only deploy to live deal flow when hit-rate and ARV MAE meet your acceptance criteria.
Update market inputs monthly; stale market data systematically mis-scores deals. Recalibrate weights quarterly for active pipelines. That cadence keeps the model aligned with shifting market conditions without requiring a full rebuild.
Human-in-the-loop governance: where does human judgment stay?
AI removes emotional bias by enforcing standardized underwriting assumptions across every deal, which is its single greatest practical benefit. But the score is an input to your decision, not the decision itself.
A governance checklist for any scoring system:
- Required sign-offs: Any deal above a defined dollar threshold requires a human underwriter to confirm the score before an offer goes out.
- Audit logs: Log every score, the model version used, and any manual overrides with a reason code. This creates a record you can analyze when recalibrating.
- Override rules: Define in advance which flag types trigger an automatic escalation: title clouds, environmental liens, or known contractor constraints in a specific submarket.
- Rubric versioning: Every weight change gets a version number and a date. Never overwrite the previous version; you need it for comparison.
When to ignore the score entirely: flagged title or environmental risks, situations where your local contractor network cannot execute the rehab at the estimated cost, or when you have off-market information the model cannot see.
Pro Tip: AI enforces consistent underwriting assumptions and kills “deal fever” by treating every property identically. Reserve human discretion for execution risks — contractor relationships, local zoning nuance, and broker dynamics — that no model can price.
Copyable scorecard template and a worked example
| Component | Raw Value | Normalized Score (0–100) | Weight | Weighted Score |
|---|---|---|---|---|
| ARV midpoint accuracy | — | 85–100 | 30% | — |
| Rehab estimate (photo) | — | 65 | 15% | — |
| MAO delta (offer vs. MAO) | — | 70–84 | 15% | — |
| Cap rate / cashflow | 7.2% | 70–84 | 20% | — |
| Market momentum | Moderate growth | — | 10% | 4% (floor) |
| Tenant/lease risk | Low | 85 | 5% | 4% (floor) |
| Environmental flag | None | 100 | 5% | 4% (floor) |
| Final Score | 100% | 74.9 |
How the normalized score is calculated: For min-max scaling, use (raw value − min) ÷ (max − min) × 100. A cap rate of 7.2% in a market where 4% is the floor and 12% is the ceiling scores (7.2 − 4) ÷ (12 − 4) × 100 = 40. Adjust your floor/ceiling assumptions per market.
A final score of 74.9 in this example falls in the “agent outreach and contractor quote” band. Export this template to Google Sheets or import it directly into Dealanalyzerai for automated batch runs. Check AI-driven ARV range methodology for guidance on setting your ARV floor and ceiling inputs.
- Copy the table above into Google Sheets and replace raw values with live deal data.
- Add a conditional formatting rule: green for scores above 85, yellow for 70–84, red below 70.
- Export scored batches as CSV and import into your CRM to trigger pipeline tasks automatically.
How do you turn scores into offers and pipeline actions?
Score thresholds translate a number into a workflow decision.
85–100: Immediate full underwrite. Pull title, order contractor walkthrough, and prepare LOI within 48 hours. Set a CRM task for your underwriter the same day the score posts.
70–84: Agent outreach and contractor quote. The deal has merit but needs one more data point before committing underwriting resources. Assign a follow-up task with a 5-day deadline.
Below 70: Archive or monitor. Log the score and the reason for the low rank. Set a 30-day re-score trigger if the asking price drops or market conditions shift.
Attach score-based alerts to your CRM so that any deal crossing the 85 threshold creates an automatic task for your acquisition team. For deals with triggered risk flags, route them to a senior reviewer rather than the standard underwriter queue. Review the deal analysis red flags list to build your escalation criteria.
Pro Tip: Set a “price drop re-score” automation: if a listed property’s asking price falls by more than 5%, the pipeline re-scores it automatically. Deals that were below 70 often cross into actionable range after a price reduction.
Dealanalyzerai: the ready solution for this scoring system
Screening dozens of properties a week with a manual spreadsheet costs you hours you do not have. Dealanalyzerai delivers the complete scoring stack described in this guide, without building it from scratch.
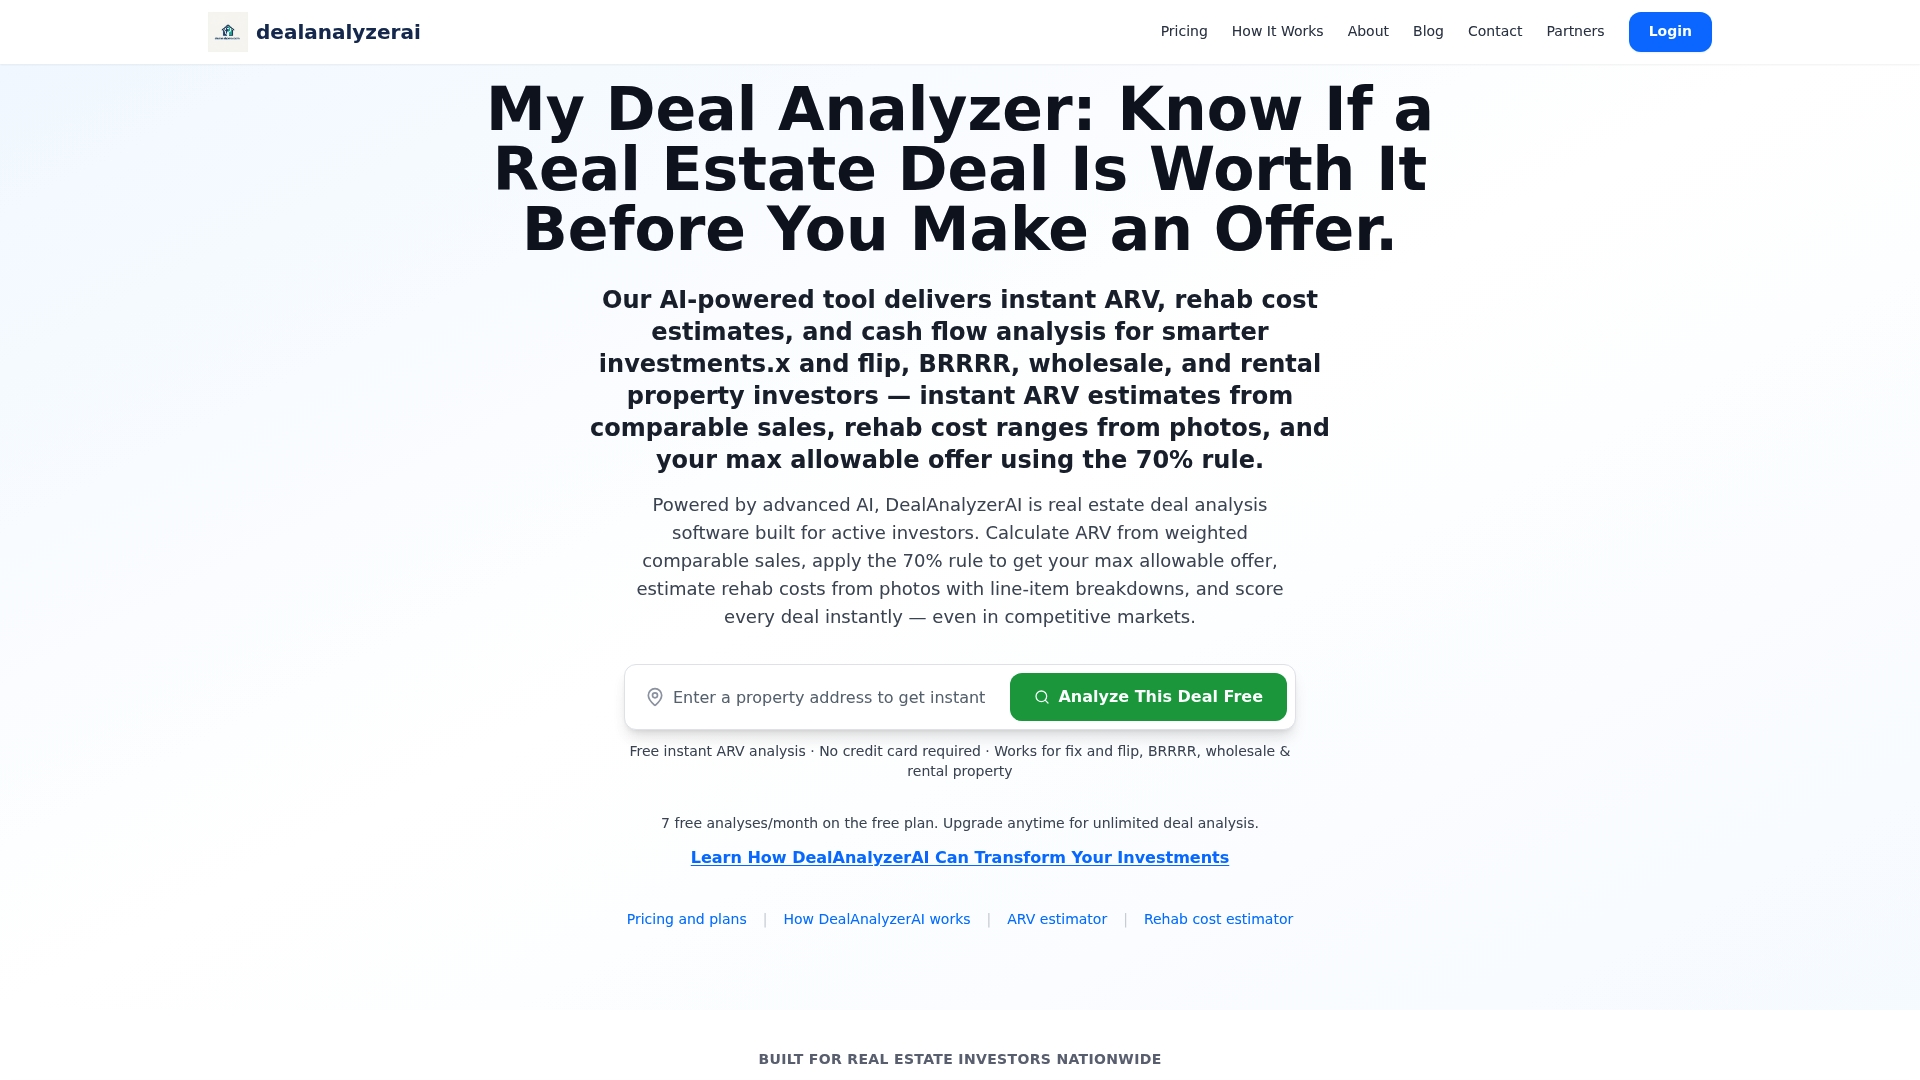
The platform covers every component: ARV ranges and MAO calculations from comparable sales, a photo-based rehab estimator validated against contractor costs, risk flag detection, cap rate and cashflow calculators, and batch scoring with CRM export. White-label reporting means your branded deal summaries go straight to partners or lenders.
30-day pilot checklist:
- Upload 20–30 historical deals and run the calibration backtest.
- Confirm ARV MAE and hit-rate meet your acceptance thresholds.
- Set your threshold bands (85/70) and connect CRM task automation.
- Run one live batch of 10–15 active pipeline properties and compare scores to your manual rankings.
Start your free analysis at Dealanalyzerai and have your first scored batch ready within the hour.
Key Takeaways
A standardized AI property score works only when it combines accurate financial inputs, calibrated weights, and a governance layer that keeps human judgment in the loop.
| Point | Details |
|---|---|
| Calibrate before going live | Test the model on 20–30 historical deals and adjust weights until rankings match your past decisions. |
| Update market data monthly | Stale market inputs systematically mis-score deals; recalibrate weights quarterly. |
| Use threshold bands | Scores of 85–100 trigger immediate underwriting; 70–84 trigger outreach; below 70 goes to archive. |
| Hard flags override scores | Title clouds and environmental liens zero the final score regardless of weighted total. |
| Dealanalyzerai covers the full stack | ARV ranges, photo rehab estimates, MAO, risk flags, and batch export are all built in and ready to pilot. |
Why standardized scoring changes how you work
The conventional wisdom in real estate investing is that experience and gut feel separate good investors from great ones. That framing is partly right and mostly dangerous at scale.
Gut feel is pattern recognition built from past deals. A scoring rubric is the same thing, made explicit and consistent. The investor who writes down their criteria, assigns weights, and runs every deal through the same model does not lose their judgment. They make it repeatable. When you screen 50 properties a week, you cannot afford to re-derive your decision criteria from scratch on each one.
The piece most investors underestimate is calibration. A model with the wrong weights is worse than no model, because it produces confident wrong answers. The 20–30 deal backtest is not optional housekeeping. It is the step that turns a generic scoring template into your scoring system. That distinction is what makes the difference between a tool you trust and one you quietly stop using after a month.
Governance matters for the same reason. Audit logs and override rules are not bureaucracy. They are the feedback loop that tells you when the model is drifting and when a human caught something the score missed. Both pieces of information make the next calibration more accurate.
Useful sources and product links
Methodology and scoring research:
Dealanalyzerai product pages (implementation):
- Free AI Real Estate Deal Analyzer — trial signup and product overview
- ARV and Deal Analysis Tool — ARV ranges, MAO calculator, and rehab estimator
- Photo-Based Rehab Estimate Calculator — contractor-validated cost workflow
- What is real estate deal scoring? — background definitions and scoring approaches
FAQ
What inputs does a standardized investment property score require?
A complete score needs ARV range, photo-based rehab estimate, MAO calculation, cashflow or cap rate, market momentum signals, and hard risk flags. Missing any one of these inputs produces an incomplete ranking.
How many historical deals do you need to calibrate the model?
Start with 20–30 labeled past deals where you know the pursue-or-pass outcome. If the model ranks your “pass” deals above your “pursue” deals, adjust category weights before going live.
How often should you update the scoring model?
Update market data inputs monthly and recalibrate weights quarterly. Stale market data systematically mis-scores deals, particularly in fast-moving submarkets.
What score threshold should trigger an immediate offer?
A score of 85–100 warrants immediate full underwriting and an LOI within 48 hours. Scores of 70–84 justify agent outreach and a contractor quote before committing further resources.
How does Dealanalyzerai support a standardized scoring system?
Dealanalyzerai provides ARV ranges, a photo-based rehab estimator, MAO calculations, risk flag detection, and batch scoring with CRM export, covering every component of the scoring model described in this guide.
Recommended
Analyze Your Next Deal with AI
Get an instant ARV estimate, rehab cost analysis, and deal score — free for 7 days.
Get Free Deal Breakdown