Market Timing in House Flipping: Protect Your Margins
Discover how market timing influences house flipping profits. Learn to model your deals for success and protect your margins effectively.
By DealAnalyzerAI Editorial Team
Real estate investing education and deal-analysis research from DealAnalyzerAI.

Market Timing in House Flipping: Protect Your Margins
Market timing matters in house flipping, but deal fundamentals matter more. Timing can amplify a good deal or accelerate a bad one, so the real skill is building a model that survives a mistimed exit. ATTOM’s Q1 2026 report shows the typical flip now takes about five and a half months to complete, and Realtor puts median gross profit at a level not seen in nearly 20 years. The JBREC + Kiavi Q1 2026 FFMI reading of 63 signals a market that rewards discipline, not optimism.
Do: Model three hold-time scenarios before writing any offer. Use local days-on-market trends, not national headlines, to set your exit timeline.
Don’t: Wait for rates to drop before acting. Analysts are clear that the era of rate-driven appreciation is over, and restructuring your deal model is the only reliable response.
Watch: Inventory levels, pending sales velocity, and local days-on-market. These three signals move before closed prices do.
Key Takeaways
Market timing shapes flip profitability, but a conservative deal model with stress-tested ARV, local indicator monitoring, and a 120-day base-case hold time protects margins regardless of where the market is heading.
| Point | Details |
|---|---|
| Hold-time drives carry cost | The typical flip takes 165 days; every extra 30 days adds roughly $4,200 in carrying costs on an average project. |
| Median gross profit is thin | Median gross profit is at a level not seen in nearly 20 years, leaving little room for ARV misses. |
| Local data beats national averages | Metro payoff timelines varied by more than 60 days in Q1 2026; always use local days-on-market and absorption rate. |
| Seasonal timing is monetizable | Seller premiums peak around May at roughly 9.5% above AVM; back-solve your project schedule to list before late August. |
| Dealanalyzerai stress-tests timing risk | The platform runs conservative, base, and optimistic ARV and hold-cost scenarios automatically before you make an offer. |
Table of Contents
- How does market timing affect house flipping outcomes?
- How do housing cycles and leading indicators work for flippers?
- What do ARV and hold-cost scenarios actually show you?
- Which timing signals should you monitor, and how often?
- How should you adjust your deal model when timing risk rises?
- What timing mistakes most often kill a flip’s profit?
- How does scenario modeling remove timing guesswork?
- The timing trap most investors fall into
- Dealanalyzerai makes timing risk visible before you commit
- Sources
- FAQ
How does market timing affect house flipping outcomes?
Five factors drive the causal chain from market conditions to flip profit: price cycles, seasonality, inventory, interest rates, and buyer preferences. Each one hits a different line item in your pro forma.
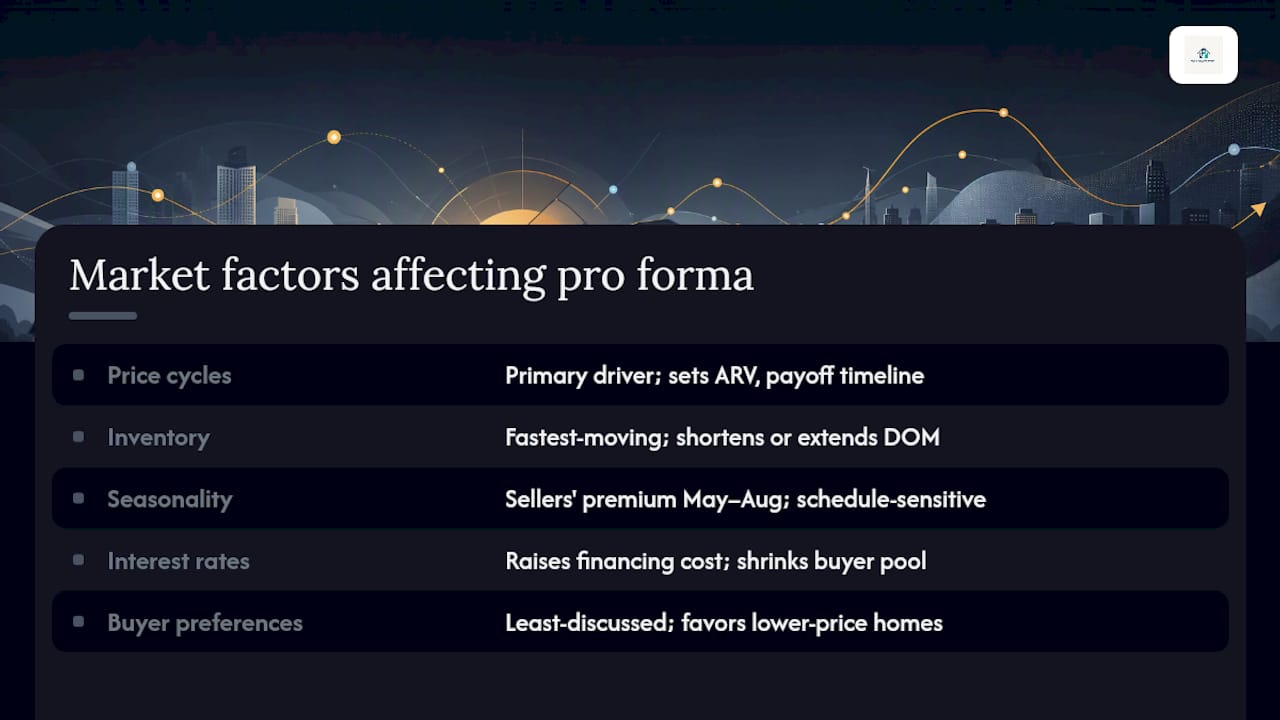
Price cycles set your ARV ceiling. When prices are rising, your exit value grows while you hold. The ATTOM and Backflip Q1 2026 special analysis confirmed that the spread between purchase price and resale price, along with payoff timeline, are the primary drivers of flip performance across metros. Payoff timelines in that analysis ranged from roughly 90 to 154 days depending on the market, a 64-day spread that translates directly into thousands of dollars in carrying costs.
Inventory is the fastest-moving variable. When active listings fall, buyer competition rises, days-on-market shrinks, and your carrying costs drop. When inventory climbs, buyers gain leverage, price cuts become common, and a 30-day extension on your hold time can cost $3,000–$5,000 in interest, insurance, and taxes on a typical project.

Seasonality is measurable and monetizable. Ahlend’s analysis found that seller premiums peak around May at a notable premium above automated valuation model estimates and stay elevated through summer. Back-solving your project schedule to list by late August captures that window. Miss it, and you are selling into a thinner buyer pool in October or November.
Interest rates affect both your financing cost and your buyer pool. Higher rates shrink the number of qualified buyers, which extends days-on-market and compresses what buyers will pay. Average renovation costs hit roughly $79K per project in Q1 2026 per the JBREC + Kiavi survey, and when that capital is financed at hard-money rates, every extra month on the clock is expensive.
Buyer preferences are the least-discussed factor. In rate-sensitive environments, buyers gravitate toward lower price points and move-in-ready finishes that minimize their out-of-pocket costs. A heavily renovated flip priced at the top of the comp range can sit while a lightly updated property at a lower price point sells in days.
How do housing cycles and leading indicators work for flippers?
Housing cycles move in phases: expansion, peak, contraction, and recovery. The critical distinction for flippers is between leading indicators (signals that move before prices change) and lagging indicators (signals that confirm what already happened). Acting on lagging data means you are pricing yesterday’s market into today’s deal.
Leading indicators to act on:
- Mortgage purchase applications (weekly, MBA): rising applications signal buyer demand building 30–60 days ahead of closed sales.
- Pending home sales (monthly, NAR): contracts signed but not yet closed; a reliable 4–6 week preview of closed-price direction.
- New listing velocity (weekly, Redfin/local MLS): a sudden surge in new listings signals sellers rushing to exit, often ahead of a price softening.
- Building permits (monthly, U.S. Census Bureau): rising permits in your target zip code increase future supply and can cap your ARV.
- Consumer confidence index (monthly, The Conference Board): a sharp drop often precedes buyer hesitation and longer days-on-market.
Lagging indicators to contextualize, not act on alone:
- Closed median sale prices (monthly, NAR/local MLS): useful for setting comps but reflect deals negotiated 30–45 days earlier.
- Foreclosure filings (monthly, ATTOM): confirm distress already in the market; rarely predictive on their own.
The practical implication: if pending sales are rising and mortgage applications are up, you can underwrite a tighter hold-time assumption. If new listings are surging and consumer confidence is falling, add 30 days to your base-case exit timeline before you write the offer.
What do ARV and hold-cost scenarios actually show you?
Three scenarios with the same acquisition price show exactly how timing shifts profit. Assume a $180,000 purchase, $79,000 in renovation costs (the Q1 2026 average from the JBREC + Kiavi survey), and $4,200 per month in carrying costs (financing, taxes, insurance, utilities).
The base case uses the national average hold time of 165 days from ATTOM’s Q1 2026 data. The conservative scenario adds just 45 days and drops ARV by $15,000, a realistic outcome in a softening local market. That combination nearly eliminates the entire profit. The optimistic scenario, by contrast, requires both a faster exit and a higher ARV than the base case, which means it should never be your underwriting assumption.
- Start with the conservative scenario to set your maximum allowable offer (MAO).
- Run the base case to confirm the deal still works at average market conditions.
- Use the optimistic scenario only to understand upside, never to justify the purchase price.
Buyers negotiate, appraisers are conservative, and markets move. That buffer is what separates a profitable flip from a break-even one.*
The Welend LLC 2026 analysis shows gross ROI in 2025 fell to its lowest level since 2008. At that margin level, a single 45-day extension in hold time can cut your net return by half on a leveraged deal.
Which timing signals should you monitor, and how often?
A practical monitoring cadence prevents you from reacting to noise while keeping you current on the signals that actually move deal math.
Daily alerts:
- Mortgage rate changes (Mortgage News Daily): a 25-basis-point move affects buyer qualification thresholds and can shift your buyer pool overnight.
- New listings in your target zip codes (Redfin, Zillow alerts): sudden inventory spikes are an early warning sign.
Weekly dashboard:
- MBA mortgage purchase application index: directional signal on buyer demand.
- Days-on-market for active listings in your comp set (local MLS): the single most actionable local timing signal.
- Redfin housing market data for pending sales and price-cut percentages.
Monthly deep-dive:
- ATTOM flip report: national and metro-level flip rates, hold times, and gross ROI trends.
- JBREC + Kiavi FFMI survey: the Fix and Flip Market Index reading tells you whether active flippers are feeling more or less confident than the prior quarter. An FFMI of 63 (Q1 2026) indicates moderate conditions, not expansion.
- NAR pending home sales and existing home sales: confirms or contradicts what your weekly data suggested.
- Local MLS absorption rate: months of supply below 3 favors sellers; above 6 favors buyers.
The ATTOM and Backflip analysis reinforces why local data outperforms national headlines. Metro-level payoff timelines varied by more than 60 days in Q1 2026. A national average tells you almost nothing about your specific market.
Pro Tip: Build a one-page weekly dashboard in a spreadsheet with five cells: local days-on-market, active inventory count, pending sales count, current hard-money rate, and your target ARV from the most recent comp pull. Update it every Monday before you evaluate any new deal.
How should you adjust your deal model when timing risk rises?
When leading indicators turn negative, the right response is not to stop flipping. It is to change the model.
Underwriting adjustments:
- Drop your ARV assumption by 5–10% from your best comp, not 3%.
- Raise your contingency reserve from 10% to 15% of renovation budget. Average renovation costs are already near $79K; surprises are expensive.
- Reduce your target scope to cosmetic and mechanical work only. High-ROI renovations like kitchens and bathrooms still pencil; full additions rarely do in a compressed-margin environment.
- Lower your minimum acceptable return threshold only if the market is genuinely strong locally, not nationally.
Operational tactics:
- Accelerate your timeline by pre-ordering materials before closing and having your contractor mobilize on day one.
- Add time-based incentives to contractor agreements: a bonus for on-time completion and a daily penalty for delays beyond the agreed schedule.
- Vet contractors rigorously before signing. A contractor who misses the schedule by 30 days in a softening market can cost you the seasonal exit window. Thorough contractor vetting is not optional when timing is tight.
Financing tactics:
- Short-term bridge loans with pre-negotiated extension options reduce your exposure to a forced sale. Know the extension cost before you close, not after.
- Cash deals eliminate financing carry but tie up capital. Model the opportunity cost of that capital against the interest savings.
- For high-rate environments, shorter loan terms with lower origination fees often beat longer terms with lower rates when your exit is under 150 days.
What timing mistakes most often kill a flip’s profit?
Most timing-related losses trace back to a handful of repeatable errors. Recognizing them before you write an offer is the difference between a profitable deal and a painful lesson.
Common timing mistakes:
- Using peak-market comps to set ARV in a flattening market.
- Underestimating carrying costs by assuming a 90-day hold when local days-on-market is already at 120.
- Ignoring buyer preferences and over-finishing a property for a price point where buyers want value, not luxury.
- Stacking scope (adding work mid-project) without recalculating the hold-time impact.
- Over-leveraging on a deal where the margin only works if the ARV hits perfectly.
- Missing the seasonal exit window by starting a 90-day project in August instead of May.
Six red flags that should pause a deal:
- Local listing velocity has increased more than 20% over the prior 30 days.
- Days-on-market in your comp set has risen for three consecutive weeks.
- Your contractor’s schedule puts your list date in November or December in a cold-weather market.
- Financing terms have worsened since you underwrote the deal (rate increase, tighter LTV).
- A permit delay has pushed your timeline beyond your conservative scenario.
- Repairs uncovered during due diligence exceed your contingency reserve. Costly structural and mechanical repairs are among the most common deal-killers.
Decision checklist when a red flag appears:
- Pause and renegotiate: if the purchase price still has room to drop, go back to the seller with a revised MAO based on the conservative scenario.
- Downscope: strip the project to the minimum work needed for a marketable exit. A clean, functional property sells; a half-finished renovation does not.
- Hold as rental: if the exit market has softened and the property cash-flows at current rents, holding beats a distressed sale.
- Walk away: if none of the above restores a viable margin, the discipline to exit a bad deal is worth more than the sunk cost of due diligence.
How does scenario modeling remove timing guesswork?
Consider a concrete example. An investor is evaluating a $195,000 acquisition in a mid-size Sunbelt market. Renovation budget is $82,000. Local days-on-market has been rising for six weeks, currently sitting at 48 days versus a 12-month average of 31 days. The investor runs three hold-time inputs: 30 extra days, 60 extra days, and 90 extra days beyond the base case.

At 30 extra days of carry ($4,200/month), profit drops by $4,200. At 60 extra days, the deal loses $8,400 from the base-case margin. At 90 extra days, the combined effect of higher carry and a likely ARV reduction to close the deal erases the profit entirely on a deal that looked solid at first glance.
An AI deal-analysis tool surfaces these sensitivities automatically. It flags that local days-on-market is trending above the 12-month average, adjusts the hold-time assumption in the base case, and recalculates the MAO accordingly. The investor sees the risk before making an offer, not after closing.
The outputs that matter most: MAO ranges tied to each scenario, stress-tested profit bands across ARV assumptions, and speed-to-exit sensitivity showing the dollar cost of each additional 30 days on the clock.
Pro Tip: Run the conservative scenario first and ask: “If this deal only returns $5,000, do I still want it?” If the answer is no, the deal needs a lower purchase price, a narrower scope, or both before you proceed.
The ATTOM Q1 2026 flip report showed flipping returns rose for the first time in seven quarters, which is encouraging. But that improvement came from investors who had already tightened their models, not from a market that suddenly became easy again.
The timing trap most investors fall into
The conventional wisdom says “time the market, not the deal.” That framing is backwards. The investors who consistently profit are not better at predicting market direction. They are better at building deals that survive a wrong prediction.
The real timing trap is psychological: when rates are low and prices are rising, investors loosen their ARV assumptions and extend their scope because the market seems to forgive mistakes. When conditions tighten, those same habits produce losses. The data bears this out.
Three rules of thumb worth keeping:
- Target a hold time of 120 days or fewer in your base case. If local days-on-market makes that unrealistic, reprice the deal.
- Use an ARV buffer of at least 7% below your best comp. Markets negotiate, and appraisers rarely hit the optimistic number.
- Select markets where absorption rate is below 4 months of supply. Above that threshold, your exit timeline risk rises faster than your ARV upside.
Stress-test every deal against local data, not national headlines. A national average hold time of 165 days means nothing if your target zip code is averaging 90 days or 210 days.
Dealanalyzerai makes timing risk visible before you commit
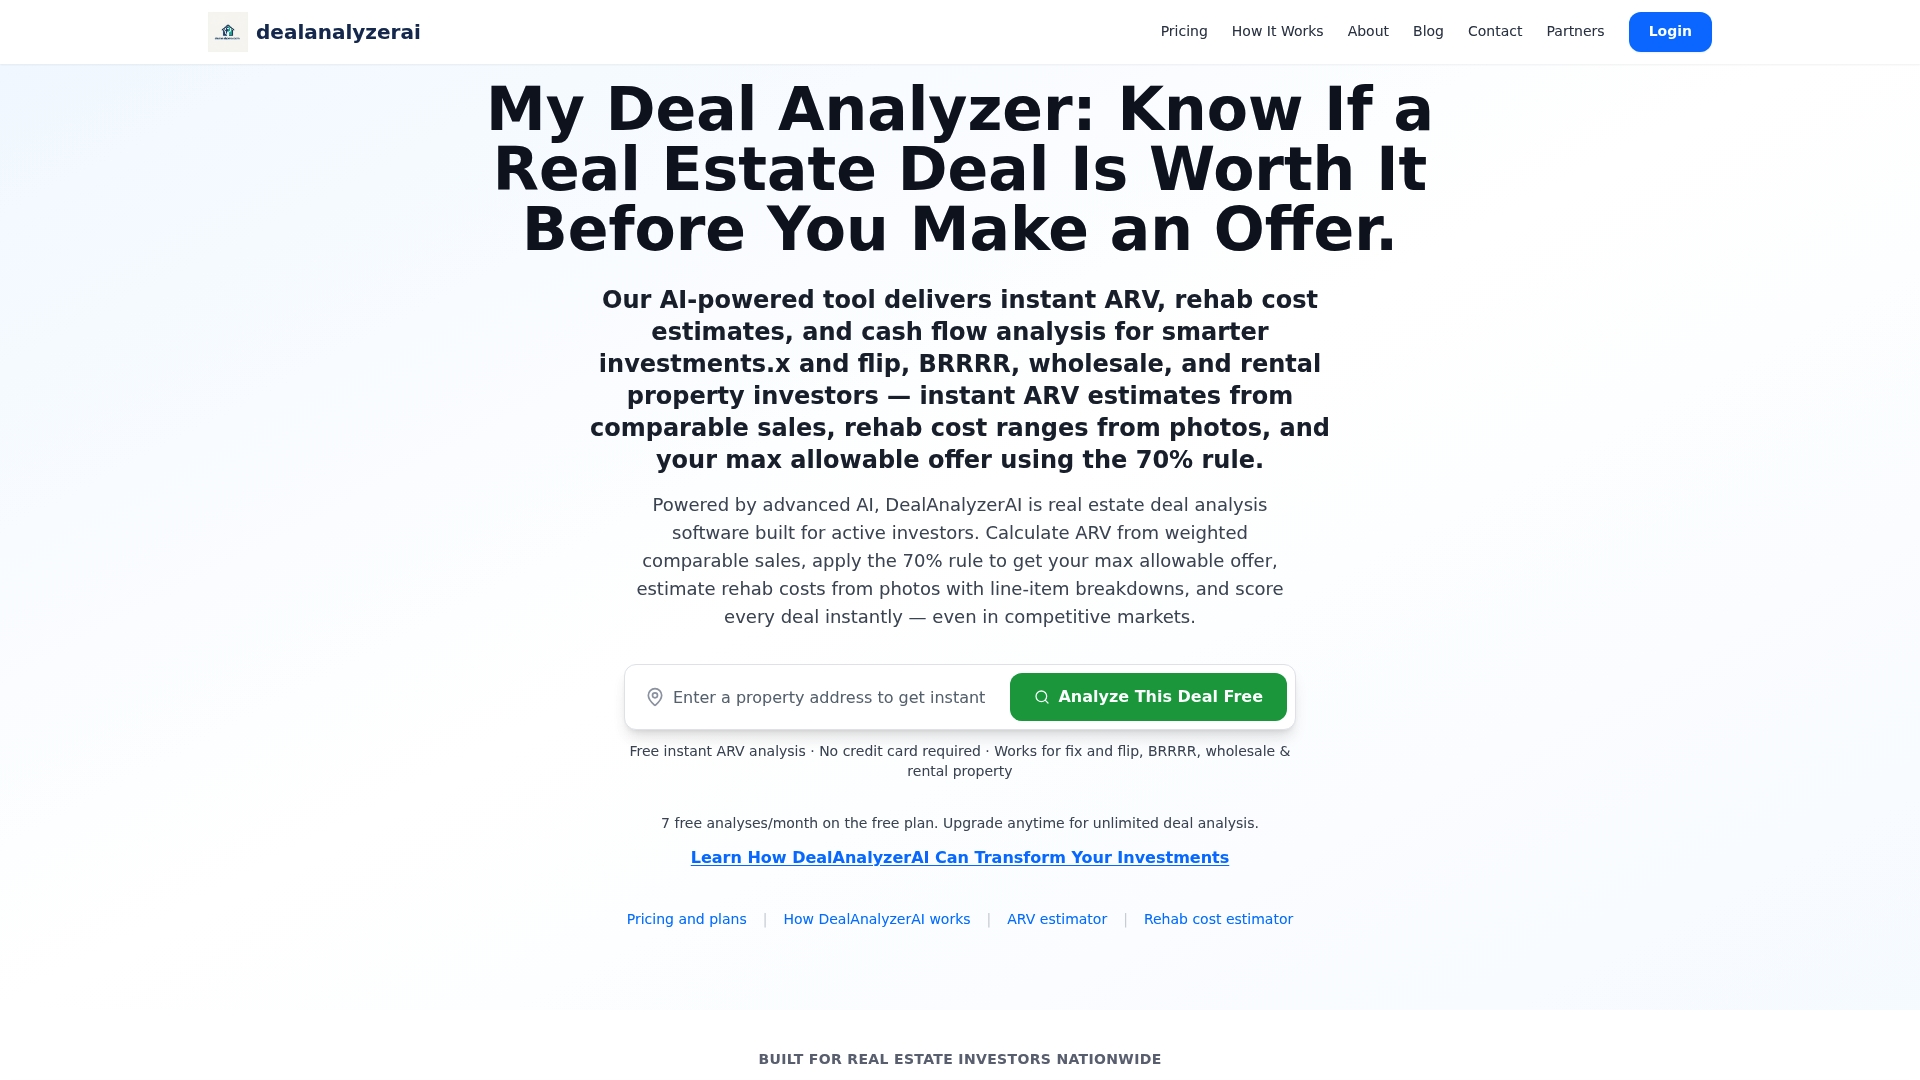
Timing risk is invisible until you quantify it. Dealanalyzerai’s AI-powered deal analyzer runs the three-scenario stress test described in this article automatically, surfacing ARV ranges, MAO calculations, and hold-cost sensitivity in one report.
Three features that directly address timing risk:
- Stress-tested ARV ranges: AI-evaluated comparable sales generate a conservative, base, and optimistic ARV so you never anchor on a single number.
- Photo-driven rehab cost estimates: upload property photos and get renovation cost estimates that reflect actual scope, reducing the gap between budget and reality.
- Carry-cost scenario modeling: adjust hold time in 30-day increments and see the dollar impact on profit margin instantly.
Run the conservative scenario on your next deal before you make an offer. Start your free trial at Dealanalyzerai and test the timing risk on a live deal today.
Sources
These are the primary data feeds and reports worth monitoring on a regular basis:
Monthly reports to follow:
- Home Flipping Returns Edge Up After Seven Quarters of Decline
- Home flipping profits plunge to lowest levels in nearly 20 years
- Home flipping isn’t dead, but the easy money is gone
- The Summer Flip Window: 90-Day Projects for Fall
Weekly monitoring:
Practical schedule: spend 15 minutes every Monday on the weekly feeds, and do a full monthly deep-dive on the first weekend after each ATTOM or NAR release.
FAQ
What is the 70% rule in house flipping?
It is a quick underwriting filter, not a substitute for a full scenario analysis with local hold-time assumptions.
Is market timing a reliable strategy for house flippers?
Timing is one input, not a strategy on its own. Deals built on conservative ARV buffers and stress-tested hold times outperform deals that depend on favorable timing, because markets rarely cooperate with a single-scenario assumption.
What are the most common house flipping mistakes related to timing?
The most frequent errors are using peak-market comps to set ARV in a softening market, underestimating carrying costs by assuming a shorter hold time than local days-on-market supports, and missing the seasonal exit window by starting a project too late to list in the May–August premium period.
Is it a good time to flip houses right now?
ATTOM’s Q1 2026 data shows flipping returns rose for the first time in seven quarters, a positive signal. Whether it is the right time in your specific market depends on local absorption rate, days-on-market trends, and whether your deal model survives the conservative scenario, not the national average.
Recommended
Analyze Your Next Deal with AI
Get an instant ARV estimate, rehab cost analysis, and deal score — free for 7 days.
Get Free Deal Breakdown