Close Capital With an Investor Presentation Deck Built on Underwriting
10–15 slide underwriting first investor presentation deck that closes capital. Shows where evidence belongs and maps DealAnalyzerAI outputs.
By DealAnalyzerAI Editorial Team
Real estate investing education and deal-analysis research from DealAnalyzerAI.

Close Capital With an Investor Presentation Deck Built on Underwriting
An investor presentation deck has one job: get a capital partner to commit, or give an acquisition a defensible paper trail. That means leading with headline returns and a tight investment thesis, keeping the main deck to 15 slides or fewer, and pushing detailed underwriting into the appendix. The metrics that carry the deck are IRR, equity multiple, cash-on-cash return, and cap rate. Everything else is support material.
TL;DR:
- Showing only an ARV range with supporting comps and adjustment logic increases credibility and reduces diligence stalls.
- Including separate base, upside, and downside cases for returns demonstrates realistic risk profiles and varies investment scenarios.
- Presenting detailed underwriting assumptions, including revenue, expenses, and sensitivity analysis, strengthens trust and transparency.
- Building your appendix with full pro formas, bids, and property details ensures your deck can withstand investor scrutiny.
- Ensuring regulatory compliance with SEC rules and clearly pairing risks with mitigants protects against legal and disclosure issues.
Table of Contents
- Slide-by-Slide Outline for a 10-15-Slide Investor Deck
- How Do You Build Defensible Return Metrics?
- Why Does a Single ARV Number Hurt Your Credibility?
- What Regulatory Language Belongs in the Deck?
- Design Rules That Make a Deck Scannable
- What Exhibits Belong in the Appendix?
- Turning DealAnalyzerAI Outputs Into Deck-Ready Slides
- Your Pre-Send Checklist
- How DealAnalyzerAI Builds the Underwriting Behind Your Deck
- Sources
- FAQ
Slide-by-Slide Outline for a 10-15-Slide Investor Deck
Every slide should carry exactly one message. If a slide is doing double duty, it belongs in the appendix instead. Practitioners who build these decks for a living recommend this structure and sequencing, and it holds up across single-family flips and multifamily syndications alike.
Here’s the order that works:
- Cover slide — property name, address, and deal type.
- Investment summary — purchase price, equity required, hold period, projected returns, and a two-sentence thesis. This is the slide investors read twice.
- Market opportunity — two or three cited data points on rent growth, absorption, or population trends, plus your comp-selection logic in one sentence.
- Property overview and business plan — current condition, scope of work, timeline, and three or four key photos.
- Sources & uses — purchase price, closing costs, rehab budget, reserves, debt, and equity, side by side.
- Returns — base, upside, and downside cases with the variables that move each one.
- Team — track record metrics, not job titles.
- Terms and next steps — where legal terms and investor rights get signposted, with a pointer to the subscription documents.
A few things separate a deck that lands from one that gets shelved:
- The investment summary states the equity required and the maximum allowable offer, not just the purchase price.
- The market slide cites sources by name instead of asserting “strong rental demand” with nothing behind it.
- The returns slide shows a range, never a single confident number with no downside case attached.
Detailed rent rolls, contractor bids, and full pro formas stay out of the main narrative. Institutional investment committees read the recommendation and the key risks first, so keeping the appendix close in structure to the slide sequence matters more than cramming extra proof into the body.
How Do You Build Defensible Return Metrics?
IRR, equity multiple, cash-on-cash, cap rate, and NOI each answer a different investor question, and using the wrong one in the wrong context is a common way decks lose credibility. IRR captures time-weighted return across the full hold. Equity multiple shows total cash back relative to cash invested, ignoring timing. Cash-on-cash measures annual distributions against equity invested, which matters most to investors who need income now rather than appreciation later. Cap rate and NOI describe the property’s unlevered performance, independent of financing.
Acquisition underwriting is the intellectual core of the deal, and it needs to show its work: revenue assumptions, operating expense assumptions, financing terms like LTV and DSCR, and a real sensitivity analysis, not a single static projection.
Build three cases, minimum:
- Base case using your actual underwritten assumptions.
- Upside case stress-testing faster lease-up or lower cap rate at exit.
- Downside case stress-testing higher rates, slower absorption, or rehab overruns.
Appendix exhibits should include rent comps, contractor bids, trailing-12-month financials, and any property condition assessment summary. Document exactly how each comparable was selected and adjusted.
Pro Tip: Build your appendix folder before you build the slides. If you can’t find a bid or a comp sheet to back a number, that number doesn’t belong in the deck yet.
For a fuller walkthrough of pro forma structure, the underwriting guide covers assumption-building in more depth.
Why Does a Single ARV Number Hurt Your Credibility?
A single blended after-repair value with no supporting logic is the fastest way to lose an experienced investor’s trust. Separate current condition, planned scope, and stabilized condition into three distinct pictures, each backed by its own evidence.
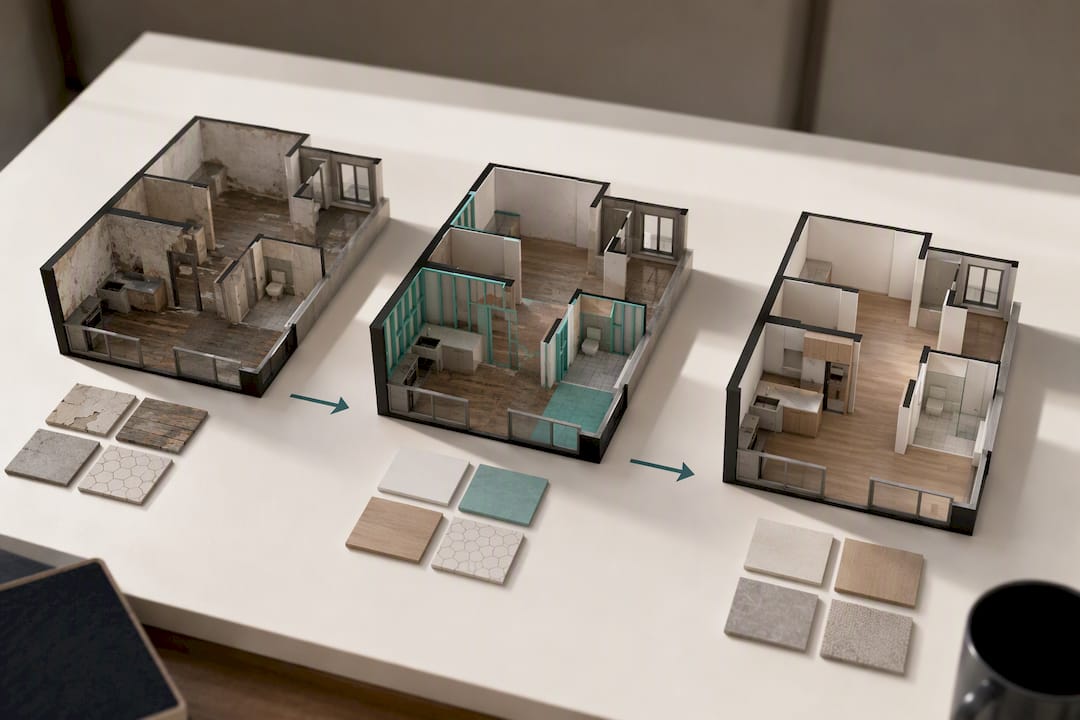
Show the comparable-sale logic explicitly: which comps you chose, why, and what adjustments you made for condition, size, or location. Attach contractor bids for the line-item rehab budget rather than a lump “renovation cost” figure. Underwriters should never present one ARV without showing that adjustment trail, and skipping it is one of the most common reasons diligence stalls.
What belongs on this slide and in its backup:
- Before-condition photos paired with the planned scope for each major system (roof, HVAC, kitchens, flooring).
- A line-item rehab budget with a contingency percentage, not a round number pulled from memory.
- A timeline showing draw schedule and how delays get absorbed.
Photo-driven rehab estimating tools have made this easier to substantiate. Translating photo evidence directly into line-item cost estimates gives investors something concrete to check against the bids in your appendix, rather than a number they have to take on faith.
What Regulatory Language Belongs in the Deck?
A presentation deck is marketing material. It is not, and never should be presented as, a substitute for a formal offering document. Rule 506(b) allows unlimited capital raises from accredited investors with limited general solicitation, and it requires Form D filing generally within 15 days of the first sale. Bring in non-accredited investors and additional disclosure obligations kick in immediately, which is the point where counsel review stops being optional.
Regulation D status is not a quality stamp from any regulator. Investor warns that private placements are often illiquid and that vague answers to investor questions are a red flag worth escalating.
Group your risks and pair each one with a mitigant:
- Market risk (rent softening) paired with your downside-case cash-on-cash floor.
- Execution risk (rehab delays) paired with your contingency reserve and draw schedule.
- Liquidity risk (no secondary market) paired with your stated hold period and exit assumptions.
Keep fees, liquidity limits, and conflicts of interest easy to find, never buried in a footnote. A risk-flag review before distribution catches most of what an investor’s own diligence would eventually surface.
Design Rules That Make a Deck Scannable
One primary message per slide is the rule that fixes most bad decks. If an investor has to read a slide twice to find the point, the slide has failed.
Lean on visuals instead of paragraphs:
- A returns chart showing base/upside/downside side by side.
- A sources & uses table, not a bulleted list of numbers.
- A timeline graphic for the rehab and hold schedule.
- A market map showing your comps relative to the subject property.
- Photo evidence next to the scope-of-work line items it supports.
Team bios should run two or three lines, followed by track record metrics: deals closed, capital deployed, average return delivered. Skip the resume format. Keep branding consistent across every slide, and name your appendix files so each one maps directly to the slide claim it backs, such as “Appendix C, Rent Comps, Slide 6.”
Pro Tip: If a slide needs a paragraph of text to make sense, the information belongs in the appendix, not the main deck.
What Exhibits Belong in the Appendix?
The appendix is where diligence actually happens. Investors and lenders open these files first when they want to verify a claim, so organize them the way your slides reference them, not the way you happen to have them saved.
- Full pro forma model with assumptions labeled.
- Rent roll and trailing-12-month financials.
- Comparable sales detail with adjustment logic.
- Contractor bids and property condition assessment summary.
- Environmental site assessment abstracts, where relevant.
- Title and survey excerpts and insurance quotes.
- Subscription documents and PPM, when applicable. A PPM typically covers the executive summary, terms, fee disclosure, and deal-specific risk factors.
Version and name every file so it traces back to the exact slide claim it supports. A due diligence checklist can help confirm nothing critical is missing before you send it out.
Turning DealAnalyzerAI Outputs Into Deck-Ready Slides
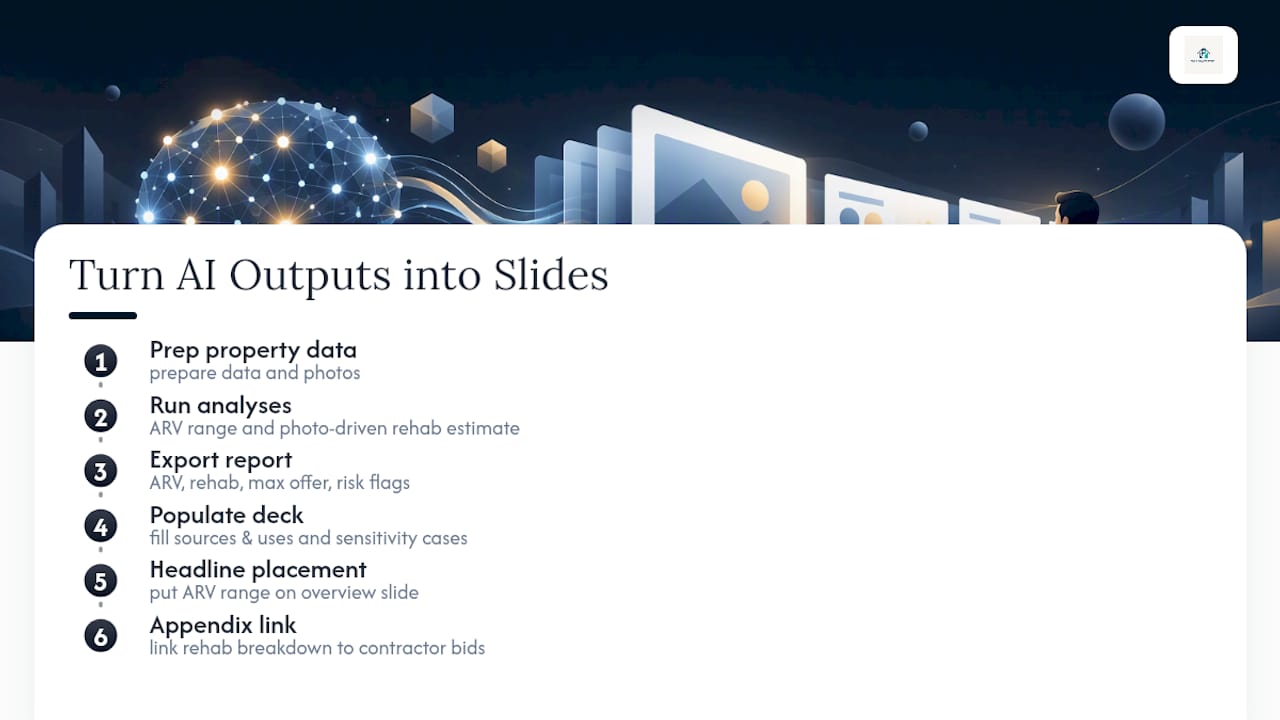
DealAnalyzerAI outputs map directly onto the sections above. Run a property through it and you get an ARV range, a photo-driven rehab estimate, a maximum allowable offer, and risk flags, all exportable as a report.
The workflow: prep your property data and photos, run the ARV and rehab analysis, then use general outputs to populate your sources & uses table and your sensitivity cases. Put the headline ARV range on the property overview slide, and link the rehab breakdown into the appendix where contractor bids live. That keeps the main narrative clean while giving diligence-minded investors something to check.
Your Pre-Send Checklist
Before this goes out, I confirm three things: counsel has reviewed anything touching investor terms, every appendix link opens and matches its slide claim, and I’ve re-run the downside case one more time. The last-minute red flags that kill deals are almost always the same: an unsupported ARV, a missing contractor bid, or ambiguous terms language nobody flagged until an investor asked.
How DealAnalyzerAI Builds the Underwriting Behind Your Deck
Most decks fall apart under diligence because the ARV and rehab numbers were guesses dressed up as underwriting. DealAnalyzerAI is built to close that gap by pairing comp analysis with photo-driven rehab estimating, so the numbers on your investment summary slide have a real trail behind them in the appendix.
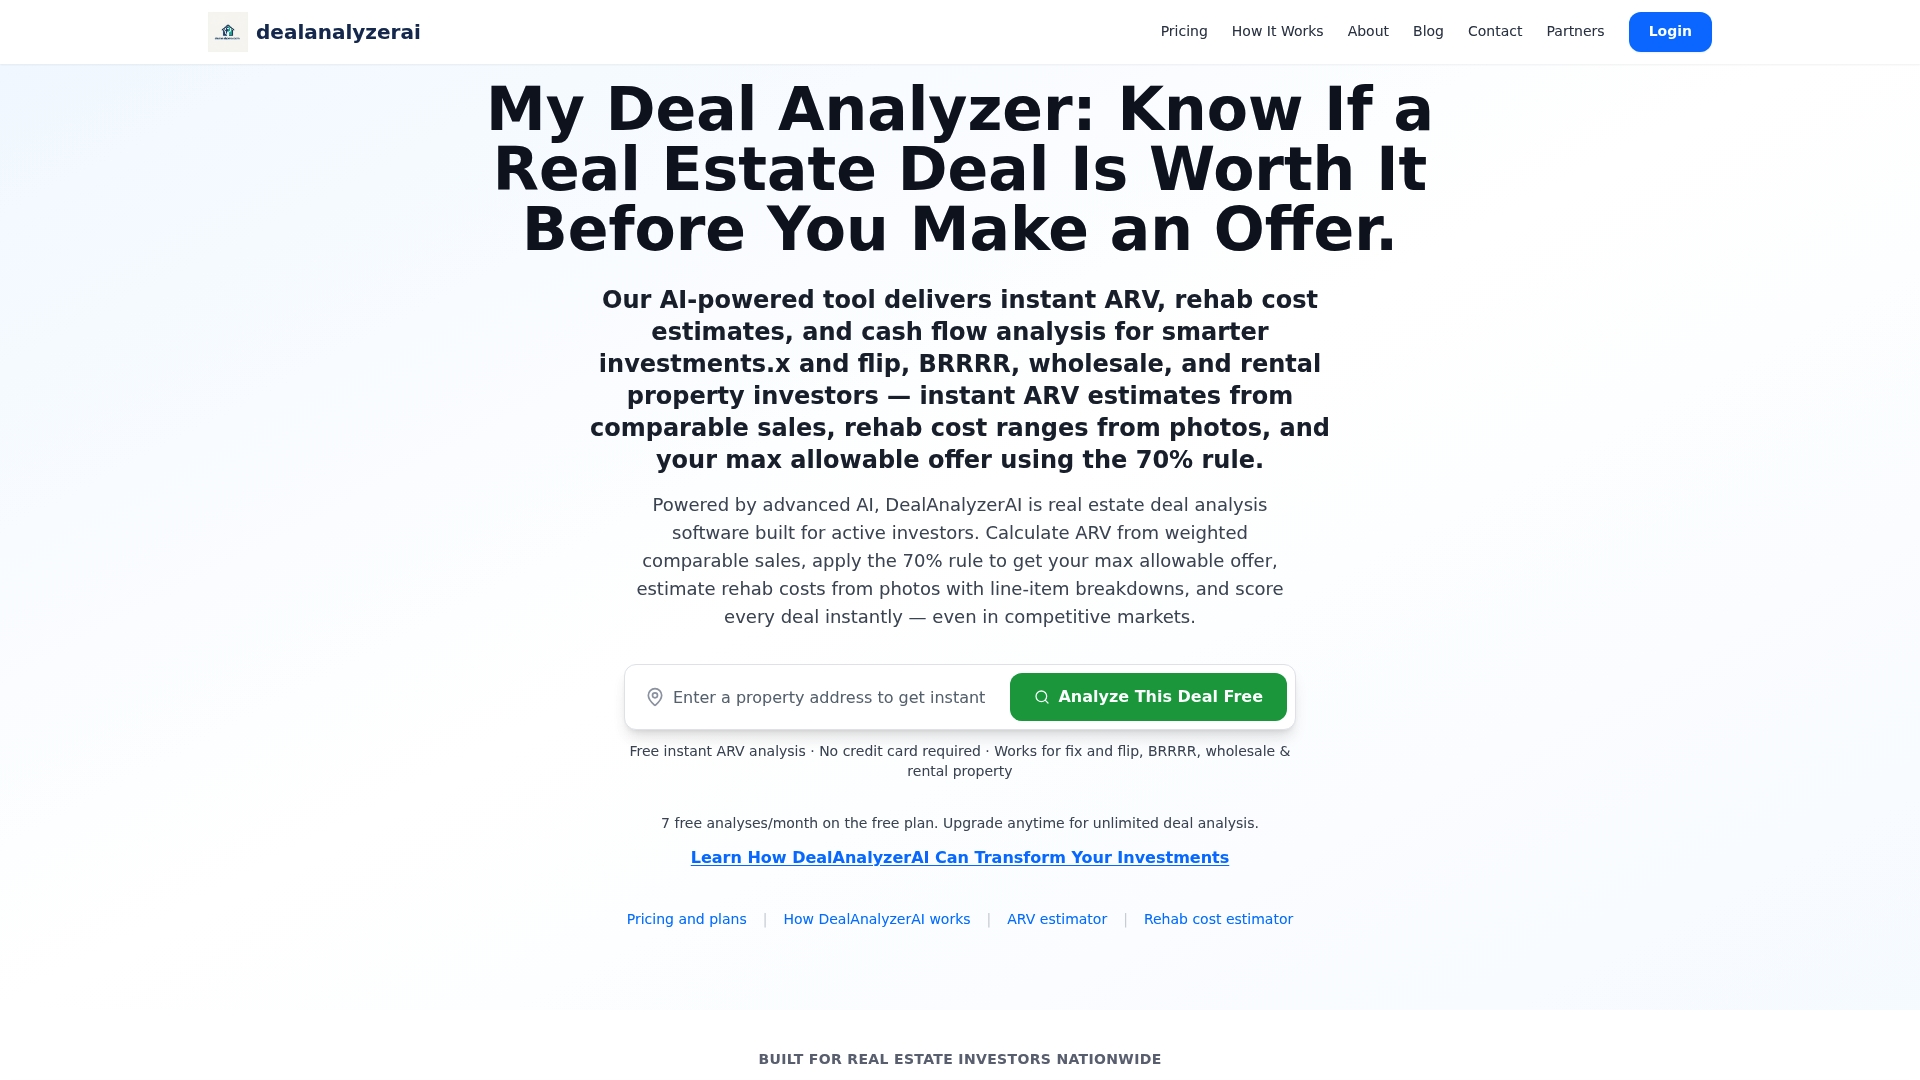
Upload property photos and DealAnalyzerAI returns an ARV range, a line-item rehab estimate, a maximum allowable offer, and risk flags in one pass, output you can drop straight into your sources & uses table and appendix exhibits instead of rebuilding them from scratch. The Renovation Estimator add-on runs at $19 per month for teams that want the photo-based rehab tool on its own, and the full Premium plan runs $97 per month or $931 annually for the complete ARV, MAO, and reporting suite. Teams building decks under their own brand can add the White-Label Upgrade at $149 per month to export reports without third-party branding. Start with the free tier on your next deal and see what the ARV range and rehab estimate look like before you build your next slide deck.
Sources
Before distributing any deck involving outside capital, confirm the offering fits within SEC Rule 506(b) requirements and Form D timing. Review Investor.gov’s bulletin on private placement disclosure expectations, and consult a PPM structure reference when drafting formal terms alongside counsel.
This article is general information, not a substitute for advice from a qualified financial advisor. Consult a qualified financial professional about your own circumstances before acting on anything here.
FAQ
How Many Slides Should an Investor Deck Have?
Keep the main presentation to 15 slides or fewer, with one primary message per slide. Detailed underwriting, comps, and contractor bids belong in the appendix, not the main narrative, following the structure institutional reviewers expect.
What Return Metrics Do Investors Expect to See?
IRR, equity multiple, cash-on-cash return, and cap rate cover the questions most capital partners ask first. Show all four on the returns slide with base, upside, and downside cases rather than a single projected number.
Does a Presentation Deck Replace a PPM?
No. A deck is marketing material; a private placement memorandum is the formal disclosure document, and Rule 506(b) requires Form D filing generally within 15 days of the first sale. Non-accredited investor participation triggers added disclosure duties that require counsel review.
How Do I Justify My ARV Without Looking Unsupported?
Separate current condition, planned scope, and stabilized condition, and show your comp-selection logic with adjustments rather than one blended number. Attach contractor bids and comp detail in the appendix so the figure on your slide has a traceable backup.
What Does DealAnalyzerAI Cost for Deck Preparation?
DealAnalyzerAI offers a free tier to generate ARV and rehab estimates, with the full Premium plan at $97 per month or $931 per year. The Renovation Estimator add-on for photo-driven rehab costs is available separately at $19 per month.
Recommended
Analyze Your Next Deal with AI
Get an instant ARV estimate, rehab cost analysis, and deal score — free for 7 days.
Get Free Deal Breakdown