Analysts: 3 Deal Sensitivity Analysis Artifacts to Make IC Ready
Practitioner playbook for analysts: build a tornado, an exit cap x rent two-way grid, and a breakeven threshold, then turn results into IC-ready...
By DealAnalyzerAI Editorial Team
Real estate investing education and deal-analysis research from DealAnalyzerAI.

Analysts: 3 Deal Sensitivity Analysis Artifacts to Make IC Ready
Deal sensitivity analysis shows you the exact combinations of inputs, exit cap rate, rent growth, refi rate, that make your IRR or NPV hold up or collapse. Read the breakeven contour and the ranked driver list first. Then produce three artifacts: a tornado chart, a two-way grid on your top two drivers, and a stress threshold statement showing how much value decline the deal absorbs before equity impairment.
TL;DR:
- Sensitivity analysis should focus on five to eight key deal drivers, with exit cap rate and rent growth typically having the greatest impact.
- Building accurate ranges based on historical volatility and correlation between inputs is crucial to avoid misleading results.
- A two-way grid can precisely identify breakeven combinations of exit cap rate and rent growth, guiding remediation strategies effectively.
- Use tornado charts to rank drivers by impact, and translate the results into clear threshold language for decision-making.
- Leveraging AI tools like DealAnalyzerAI can streamline assumption centralization, data range estimation, and risk flagging, saving time and improving accuracy.
Table of Contents
- What Is Deal Sensitivity Analysis and When Should You Run It?
- Which Deal Inputs Actually Move the Needle?
- Which Sensitivity Method Fits Which Question?
- How Do You Build an IC-Ready Sensitivity Package?
- Turning Sensitivity Output Into a Committee Recommendation
- What Mistakes Undermine a Sensitivity Analysis?
- How Sensitivity Testing Changes What Analysts Actually Recommend
- Speed Up Your Sensitivity Workflow With DealAnalyzerAI
- Where to Go Deeper on Sensitivity Methodology
- Sources
- FAQ
What Is Deal Sensitivity Analysis and When Should You Run It?
Deal sensitivity analysis varies one or two inputs continuously to show how an output, usually IRR, NPV, or covenant headroom, responds to changes in that input. You hold everything else constant, flex exit cap rate from 5.0% to 6.5%, for instance, and watch what happens to your levered IRR. That is the entire mechanism, and it’s why analysts reach for it constantly during underwriting and IC prep.
It gets confused with three other techniques, and the confusion causes real problems in memos. Sensitivity analysis differs from scenario analysis, which bundles multiple inputs into coherent narratives (a “recession case” moves rent growth, vacancy, and cap rate together as one story). It differs from stress tests, which calibrate a specific tail event. And it differs from Monte Carlo simulation, which generates full probability distributions rather than a single breakeven line.
Here’s when each tool earns its place:
- Sensitivity analysis: quick IC answers on which one or two inputs matter most
- Scenario analysis: telling a coherent story (“what does a downturn do to this deal”)
- Stress tests: calibrating a specific shock, like a 200 basis point rate spike
- Monte Carlo: when the committee genuinely needs a probability distribution, not just a range
M&A teams use sensitivity tables on synergy realization and discount rate. PE shops run them on exit multiple and hold period. CRE underwriters lean hardest on exit cap and rent growth, because those two inputs typically explain most of the variance in a levered return.
Which Deal Inputs Actually Move the Needle?
Not every assumption deserves a data table. Most models have twenty or thirty inputs, and testing all of them wastes time while burying the two or three that actually matter. A practical build process starts with five to eight candidate drivers, then expects only two or three to materially move the output.
For commercial real estate, the canonical high-impact list, roughly in order of typical variance contribution, looks like this:
- Exit cap rate, usually the single largest driver of IRR variance
- Rent growth, especially in value-add and lease-up deals
- Refi or takeout rate, critical whenever a deal assumes refinancing before exit
- Leverage and LTV, which amplifies every other input’s effect
- OpEx growth, often underweighted relative to its actual impact
- Hold period, which interacts with both exit cap and debt amortization
- Capex timing, particularly on renovation-heavy or development deals
Materiality shifts by deal type. A stabilized asset with a long-term lease cares far more about exit cap and refi rate than about rent growth, since income is already contracted. A value-add deal flips that: rent growth and lease-up speed dominate because the entire thesis depends on repositioning income. Development deals add capex timing and construction cost overrun to the top tier, since those two can single-handedly wreck a pro forma before the asset ever leases up.
If you can only build two tables before the IC meeting, pick exit cap rate and rent growth. That pairing captures the dominant risk in the vast majority of income-producing deals, and it’s the pairing every experienced reviewer expects to see first.
Which Sensitivity Method Fits Which Question?
Different questions call for different artifacts, and using the wrong one wastes a reviewer’s time. Here’s the mapping that works in practice:
- One-way data tables answer “what happens to IRR if I flex just exit cap rate from 5.0% to 6.5%?” You build these in Excel using Data → What-If Analysis → Data Table, with the input running down a column or across a row and the output formula referenced in the corner cell.
- Two-way data tables answer the sharper question: “what combination of exit cap and rent growth breaks my hurdle IRR?” This is the canonical CRE artifact, exit cap rate across the top, rent growth down the side, IRR filling the grid. You can trace the exact contour where the deal crosses your minimum acceptable return.
- Tornado charts rank every tested input by its impact on the output, sorted longest bar to shortest. Build one by running a one-way table on each candidate driver, capturing the output range for each, then plotting the ranges as horizontal bars. Building the tornado first tells you which two or three drivers deserve a full two-way grid, which saves real modeling time.
- Monte Carlo simulation adds value only when the committee needs a probability distribution rather than a deterministic range, for example, “what’s the probability we clear a 15% IRR?” It’s overkill for a routine acquisition memo.
- Stress tests calibrate a specific shock magnitude, like a 400 basis point cap rate spike or a 200 basis point refi rate increase, and answer “does the deal survive this particular event?”
Pro Tip: If your two-way data table shows stale numbers after you change an input, press F9 to force recalculation, or double-check that the row and column input cells in the table dialog actually point to your model’s live assumption cells rather than a hardcoded value.
Excel’s data table function is the mechanical backbone behind both one-way and two-way tests, and getting the input references wrong is the single most common reason a sensitivity table returns identical numbers across every cell.
How Do You Build an IC-Ready Sensitivity Package?
Speed matters, but a rushed sensitivity package that skips validation steps tends to embarrass whoever presents it. Follow this sequence:
- Centralize your assumptions. Every input that feeds the sensitivity test needs its own named cell, formatted distinctly (blue font for hardcoded inputs is the standard convention), and pulled from one assumptions tab rather than scattered across the model.
- Pick your primary metric. Decide upfront whether the committee cares most about IRR, NPV, or covenant headroom, and build your tables around that single output. Testing three metrics simultaneously dilutes the memo.
- Select five to eight candidate drivers and set ranges anchored to actual evidence, historical cap rate volatility, submarket rent comp data, lender term sheets, rather than an arbitrary plus-or-minus percentage pulled from habit.
- Run the tests in order: one-way tables on each candidate driver first, then a tornado chart to rank them, then a two-way table on your top two, and finally a stress threshold showing the value decline the deal absorbs before equity impairment.
- Sanity-check everything before it reaches the memo. Trace at least one formula path by hand, confirm the compound annual growth rate implied by your rent growth assumption matches what you’d tell a lender out loud, and recalculate the whole workbook once more.
The rental pro forma template gives you a starting structure for centralizing assumptions before you run any of this. For the memo itself, show the tornado chart and the two-way grid side by side, with one sentence underneath each stating the breakeven threshold in plain language.
Turning Sensitivity Output Into a Committee Recommendation
Numbers on a grid mean nothing until you translate them into a decision. The job of the analyst is converting a two-way table into a sentence the committee can act on.
State breakeven contours as threshold language, not raw data. Instead of presenting the full grid and letting the committee squint at it, say: “This deal clears our 15% hurdle IRR as long as exit cap stays below 6.2% and rent growth holds above 2.5% annually. Outside that combination, we’re below target.” That single sentence does the work of the entire table.
Probability-weighted statements belong in the memo only when they’re genuinely useful, and they should stay summarized rather than raw. A line like “there’s roughly a one-in-four chance this deal falls below our fifth-percentile downside case” tells the committee something a histogram doesn’t. Skip the histogram in the deck; it invites debate about methodology instead of decision.
From there, the sensitivity output points to specific remediation options:
- Reprice the deal if the breakeven contour sits too close to base case assumptions, tightening your offer price to build back margin
- Restructure terms by adding a rate cap, extending the interest-only period, or negotiating a seller-financed piece to reduce refi exposure
- Target diligence dollars at whichever input dominates the tornado chart, ordering a deeper rent comp study if rent growth ranks first, for example
The risk flags guide covers how to translate a dominant sensitivity driver into a specific diligence question before you write the offer.
What Mistakes Undermine a Sensitivity Analysis?
Most bad sensitivity work fails for the same handful of reasons, and every one of them is avoidable.
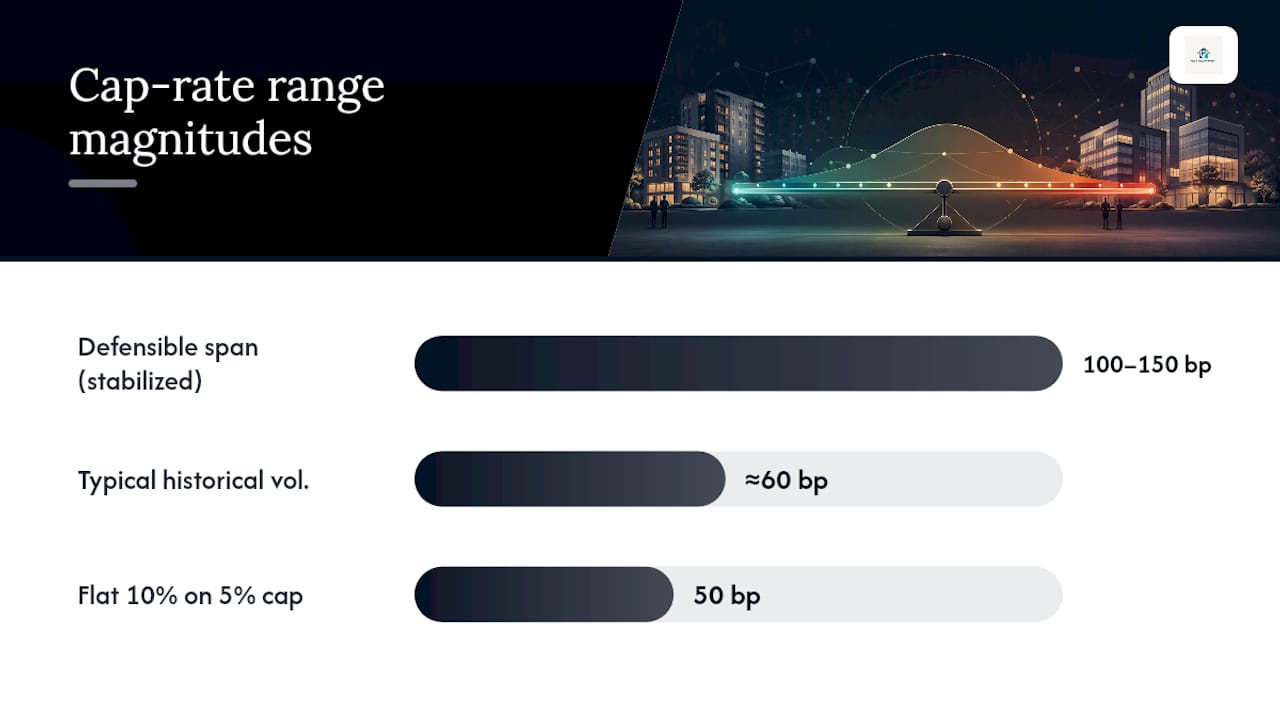
- Arbitrary ranges. Flexing every input by a flat plus-or-minus 10% feels rigorous but isn’t. Anchor your ranges to actual evidence: historical cap rate standard deviation, submarket rent comps, lender stress test magnitudes. A defensible cap rate span for a stabilized CRE asset commonly runs 100 to 150 basis points around base case, reflecting typical historical volatility of roughly 60 basis points; a flat 10% band on a 5% cap rate would swing far past what markets actually do.
- Ignoring correlated inputs. Exit cap rate and rent growth aren’t independent. They tend to move together in a downturn, both worsen, and testing them in isolation understates the real downside. Document your dependency assumptions explicitly, even a simple note saying “we tested these independently but recognize they’re correlated in a recession scenario,” rather than pretending the inputs move alone.
- Hiding the assumptions. If a reviewer can’t trace which cell feeds which table, the analysis loses credibility regardless of how sound the math is. Keep every input visible and consistently formatted.
- Skipping the interpretation. A tornado chart with no sentence underneath it is a picture, not an argument.
Pro Tip: Build a standard driver pack for each asset class, one fixed list of the five to eight inputs your shop always tests for multifamily, another for industrial, so junior analysts stop reinventing the range-setting process on every deal.
Run a quick post-build validation: does the tornado ranking match your intuition about the deal? Does the two-way grid show a smooth, monotonic surface rather than jumps that suggest a formula error? If something looks off, it usually is.
How Sensitivity Testing Changes What Analysts Actually Recommend
Sensitivity output rarely produces a clean yes or no. It produces a threshold, and the decision depends on how close your base case sits to that line. A deal that clears its hurdle IRR by two full points of cap rate cushion gets treated differently than one that clears by twenty basis points, even if both show identical headline returns.
Shop size and risk tolerance shift the required cushion. A smaller fund with less balance sheet flexibility often needs a wider margin before committing capital than a larger platform that can absorb a miss. Analysts who’ve sat through enough IC meetings learn to ask “how much room do we actually have” before they ask “does this deal work.”
— Sam
Speed Up Your Sensitivity Workflow With DealAnalyzerAI
Building the sensitivity package described above by hand, centralizing assumptions, pulling defensible ARV ranges, estimating rehab costs, flagging risk, eats hours every week when you’re screening multiple properties. DealAnalyzerAI is built for exactly that pressure: it uses AI to evaluate comparable sales and analyze uploaded property photos, generating instant ARV ranges, maximum allowable offer calculations, and risk flags you’d otherwise have to build manually into your model.

That means the inputs feeding your rent growth, rehab cost, and exit value assumptions arrive faster and with less guesswork baked into them, which is precisely where a sensitivity table’s ranges need to be defensible rather than arbitrary. The Premium plan runs $97 per month and includes the core ARV, rehab, and risk-flag tools; teams that want white-labeled reports for their own investors can add the White-Label Upgrade at $149 per month. Try the free real estate deal analyzer on your next property and see how much faster your sensitivity inputs come together.
Where to Go Deeper on Sensitivity Methodology
For the mechanics of building data tables and tornado charts in Excel, Wall Street Prep’s tutorial walks through the exact dialog steps. For prioritizing which drivers to test first, Model Reef’s guide lays out the five-to-eight-driver approach referenced above. If you’re centralizing assumptions before running any of this, start with the rental pro forma template.
If your deal involves refinancing risk, this comparison of commercial mortgage and SBA 504 loan structures is worth reading before you set your refi-rate range.
Sources
- IRR Sensitivity Analysis and Stress Testing: A Practitioner’s Guide | Apers
- Investment Case Sensitivities: What to Flex | Model Reef
- Sensitivity Analysis (What-If) | Excel Tutorial Lesson
- Managing uncertainty with sensitivity analysis | CFI
FAQ
What Are the Three Types of Sensitivity Analysis?
Practitioners generally group sensitivity work into one-way analysis (flexing a single input), two-way analysis (flexing two inputs simultaneously in a grid), and tornado analysis (ranking multiple inputs by impact). Some analysts also treat Monte Carlo simulation as a fourth category when probability distributions matter.
What Is Sensitivity Analysis, With an Example?
Deal sensitivity analysis flexes one input, say exit cap rate, from 5.0% to 6.5% while holding every other assumption constant, then reads how the output, typically IRR or NPV, responds across that range. A two-way version pairs exit cap rate with rent growth in a grid to show exactly which combinations clear your hurdle return.
How Do You Interpret Deal Sensitivity Analysis Results?
Read the breakeven contour, the line on your two-way table where the output crosses your minimum acceptable return, and state it as a threshold: “the deal clears 15% IRR as long as exit cap stays below 6.2%.” Rank the tested inputs by impact using a tornado chart to identify which one or two drivers deserve the most diligence attention.
What Are Common Mistakes in Sensitivity Analysis?
The most frequent errors are using arbitrary ranges instead of ones anchored to historical volatility, ignoring correlation between drivers like exit cap and rent growth, and hiding assumptions in a way that makes the output impossible to trace. Building a tornado chart without an interpretive sentence underneath it is another common gap.
Can DealAnalyzerAI Help With Sensitivity Testing?
DealAnalyzerAI doesn’t replace your sensitivity model, but it speeds up the inputs feeding it by generating instant ARV ranges, rehab cost estimates, and risk flags from property photos and comparable sales. Pricing starts at $97 per month for the Premium plan, listed on the pricing page.
Recommended
Analyze Your Next Deal with AI
Get an instant ARV estimate, rehab cost analysis, and deal score — free for 7 days.
Get Free Deal Breakdown